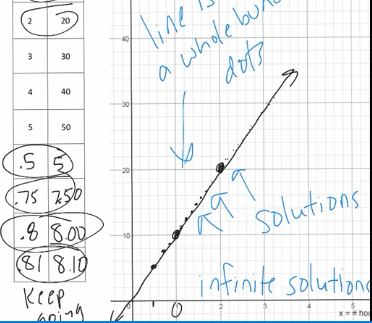

Graphing linear functions and the underlying concept are challenging for many students. The video below shows a scaffolded approach to teaching how to graph. This approach also addresses the concept of the graph as a visual representation of all possible solutions (see photo above). Students often do not realize that the line is actually comprised of an infinite set of points which represent all the solutions. Here is a link to the document used in the video.
One response to “Graphing Linear Functions”
[…] way of example, assume you have a student or students working on graphing a linear function using an XY table (image below). Using a task analysis approach, this topic can be broken up into smaller parts: […]