graphing
-
Graphing Linear Function Using Slope-Intercept – Steps

This document walks students through the steps for plotting the y-intercept and then using run and rise to plot additional points to draw a line. The handout starts with a review of prerequisite skills of identify slope and intercept in the equation. Below are slides from a Google Slides version. Link to handout here. Link…
-
Introduction to Key Characteristics of Graphs Using a Rollercoaster

I introduce key characteristics with parabolas and use the analogy of a rollercoaster. Riding once (and never a again) the Superman rollercoaster at Six Flags New England got me thinking about this. At one point the rollercaster hits ground level (a zero) and then goes underground (negative y values). Here is a handout I use…
-
Unpacking Graphs Using a Rollercoaster
I introduce key characteristics with parabolas and use the analogy of a rollercoaster. Riding once (and never a again) the Superman rollercoaster at Six Flags New England got me thinking about this. At one point the roller coaster hits ground level (a zero) and then goes underground (negative y values). Handout Here is a handout…
-
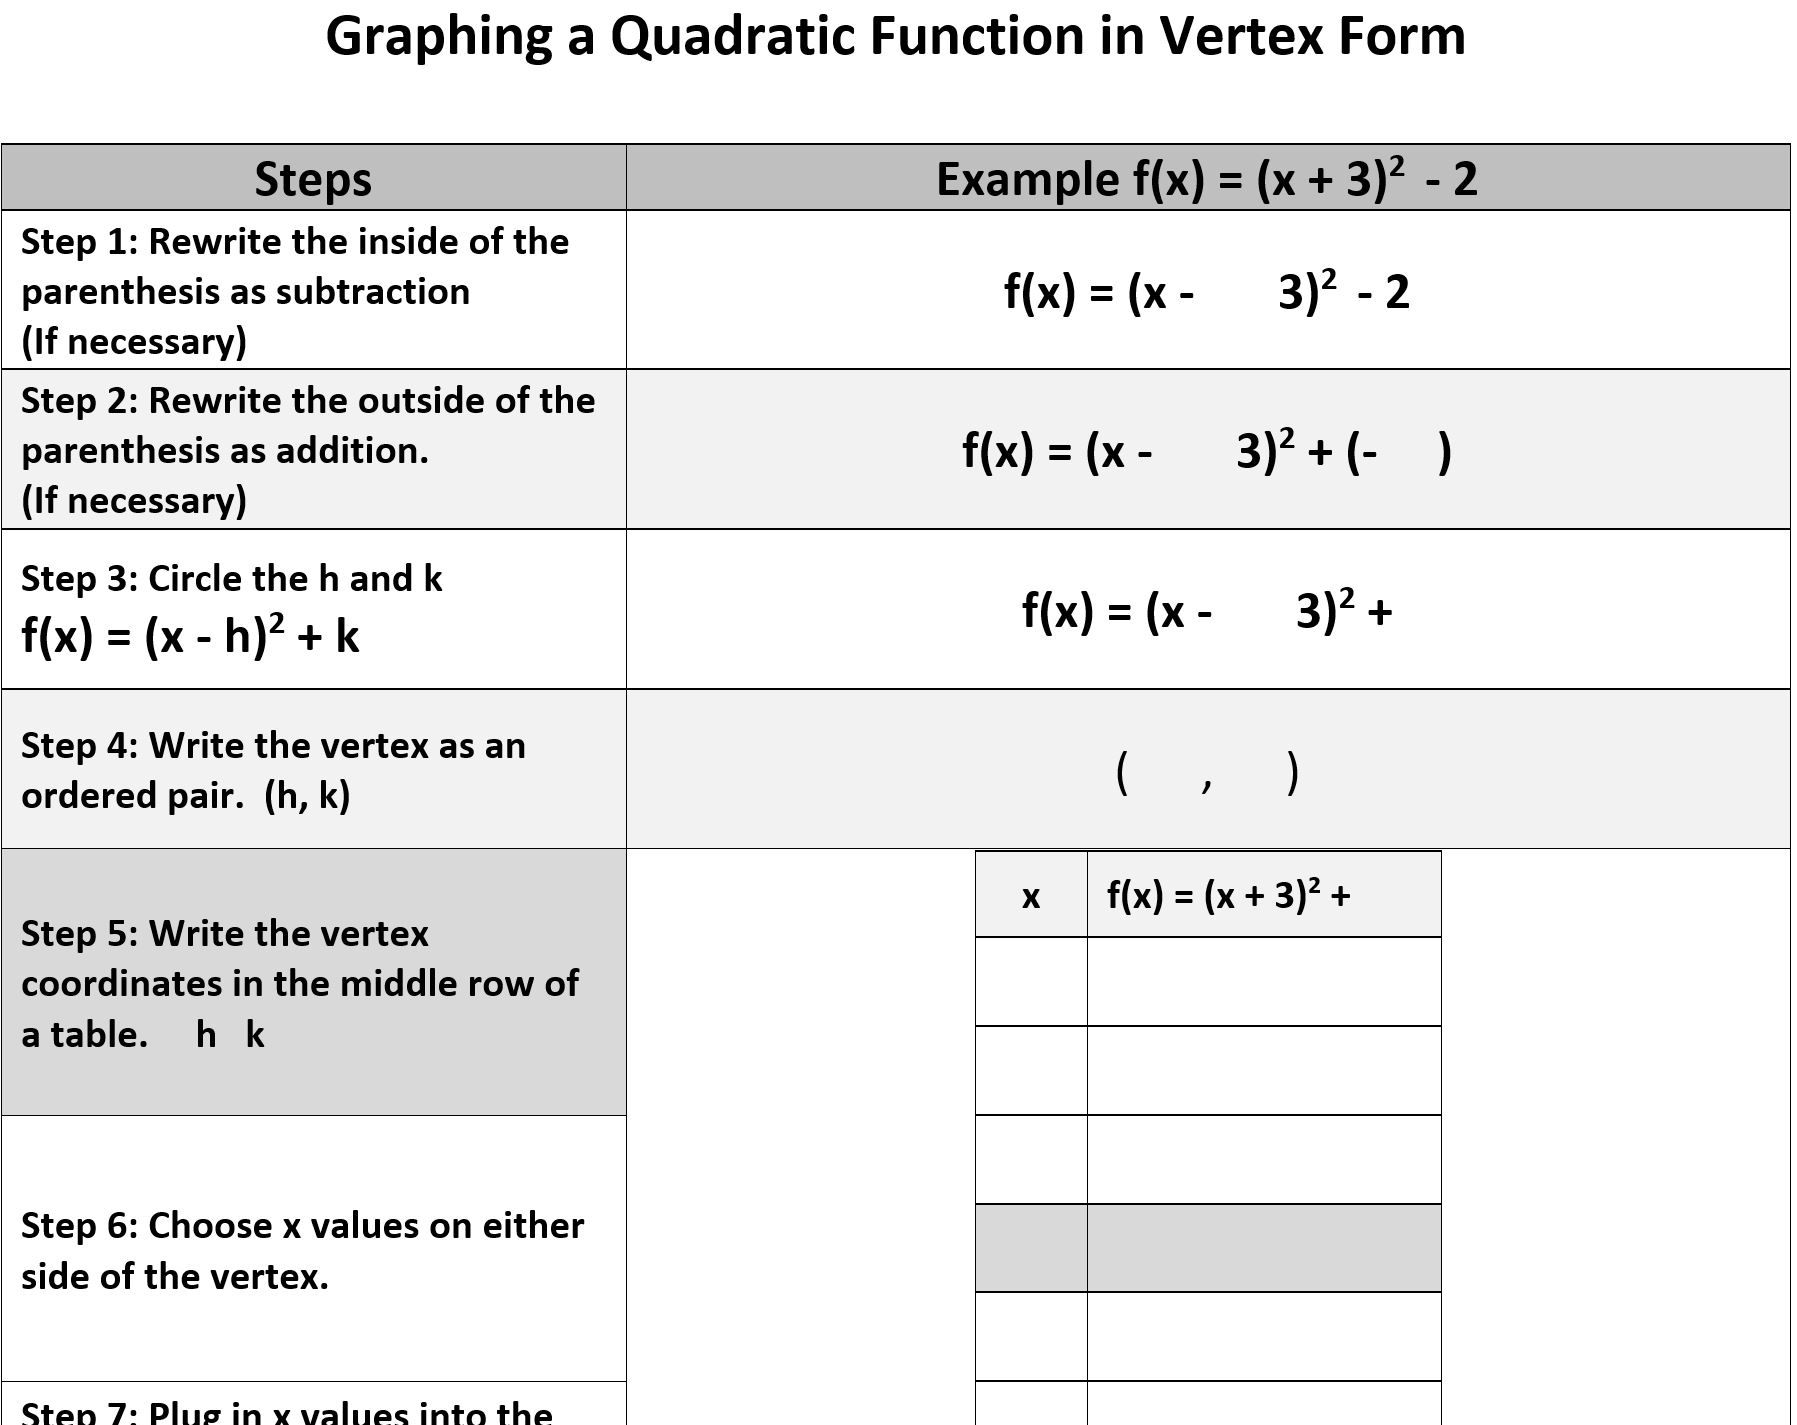
Graphing a Quadratic Function in Vertex Form – Scaffolded Handout
-
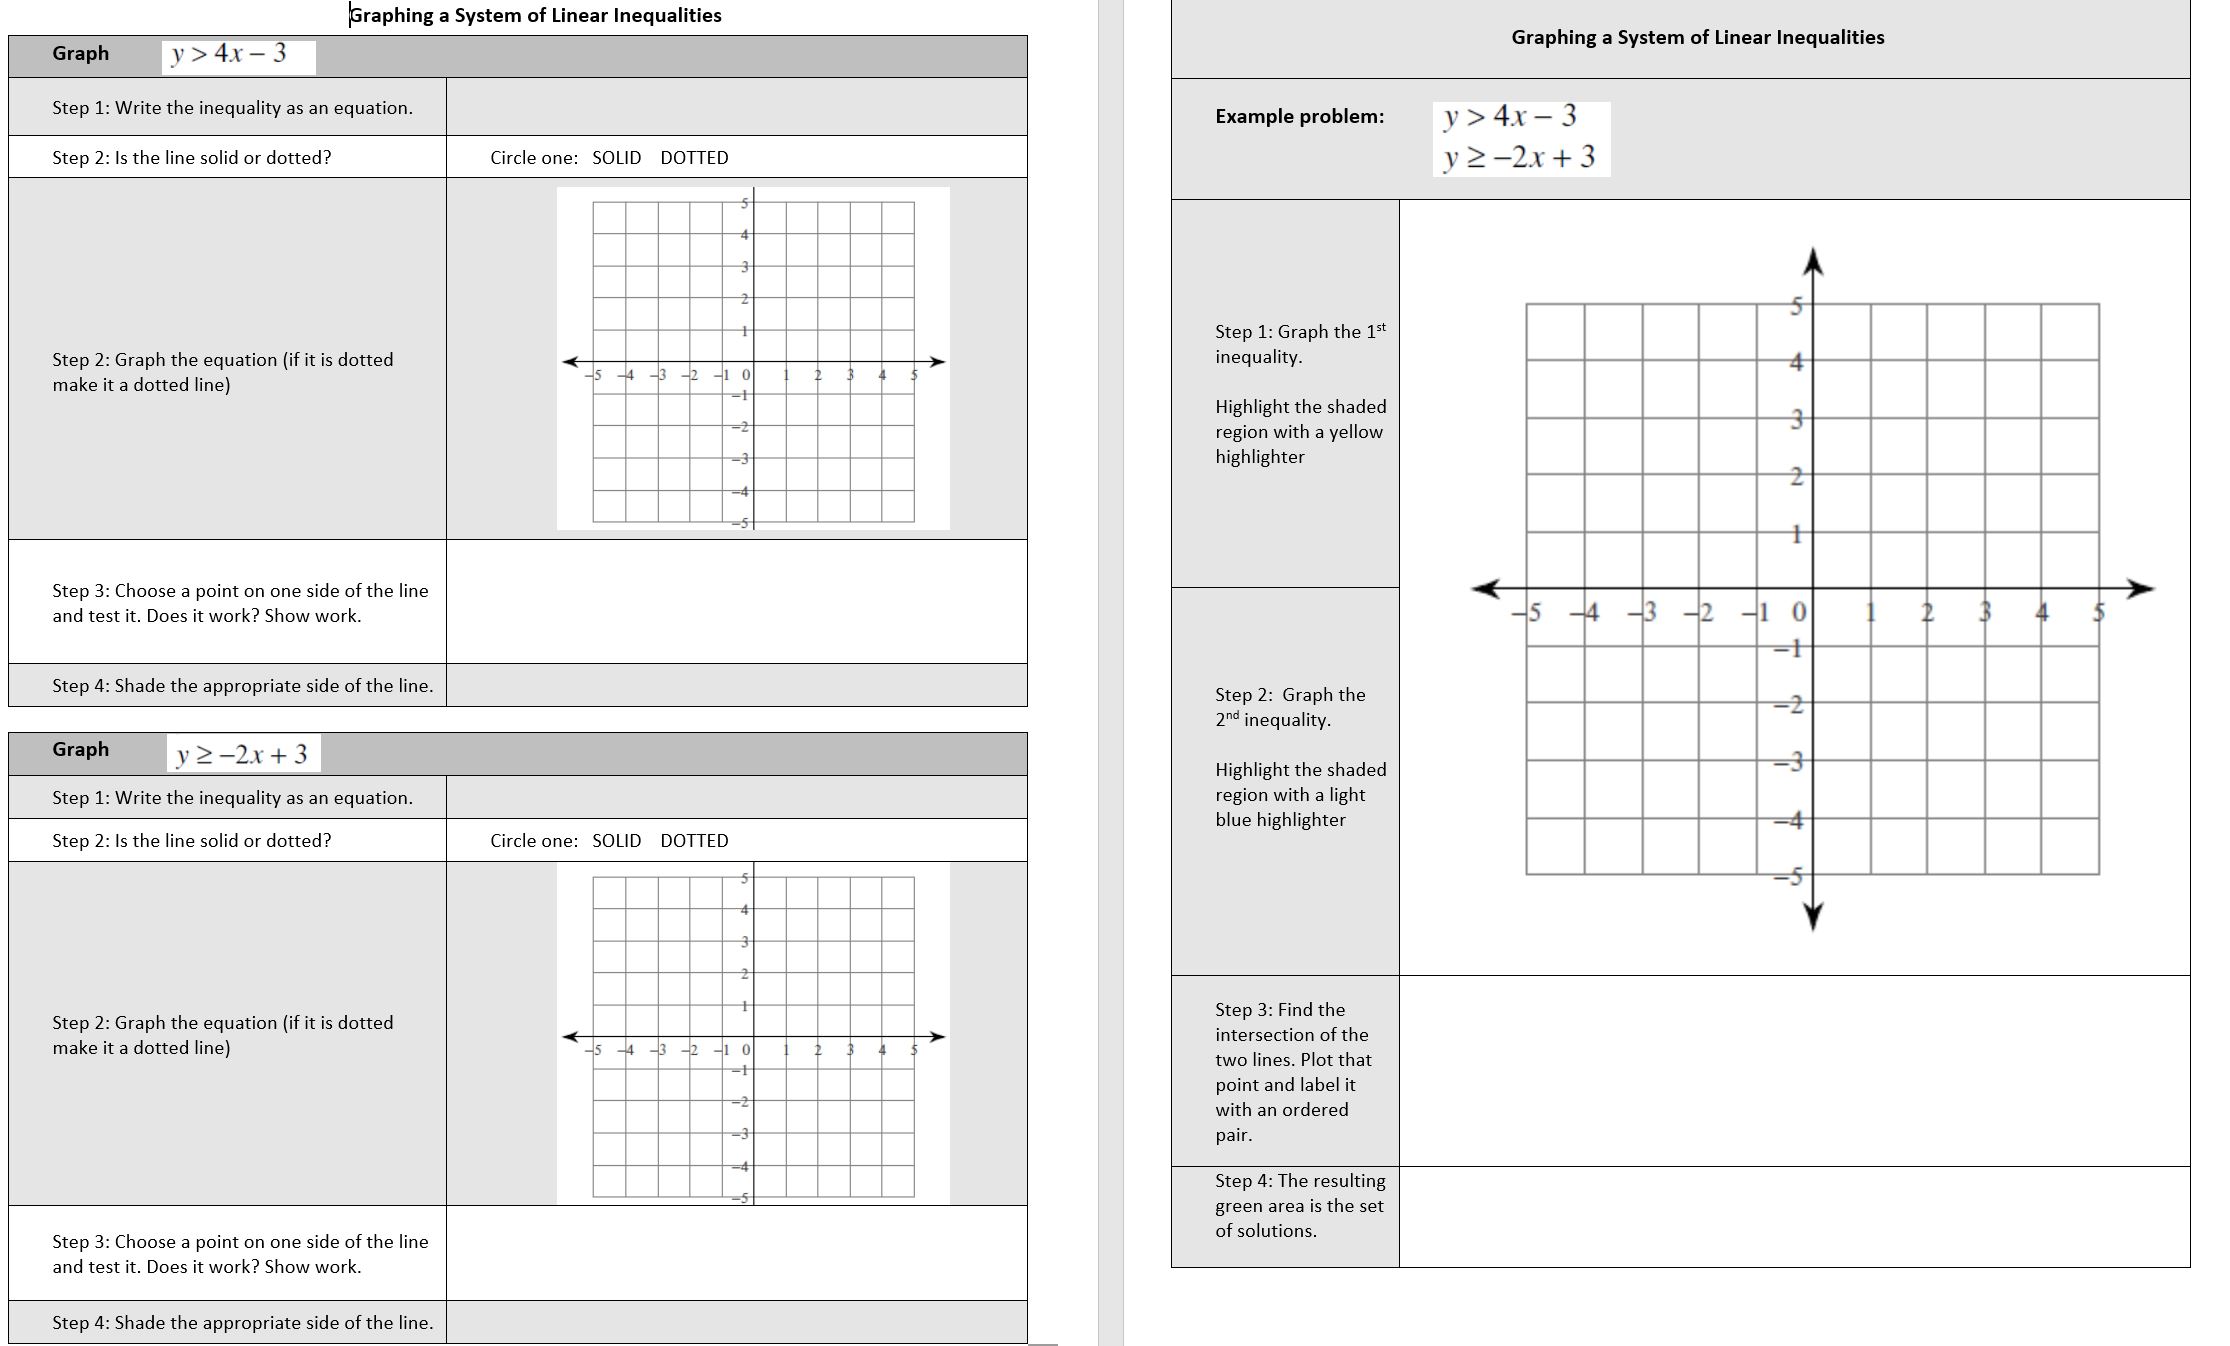
Graphing System of Inequalities – Scaffolded Handout
-
Introduction to 2 Variable Inequalities
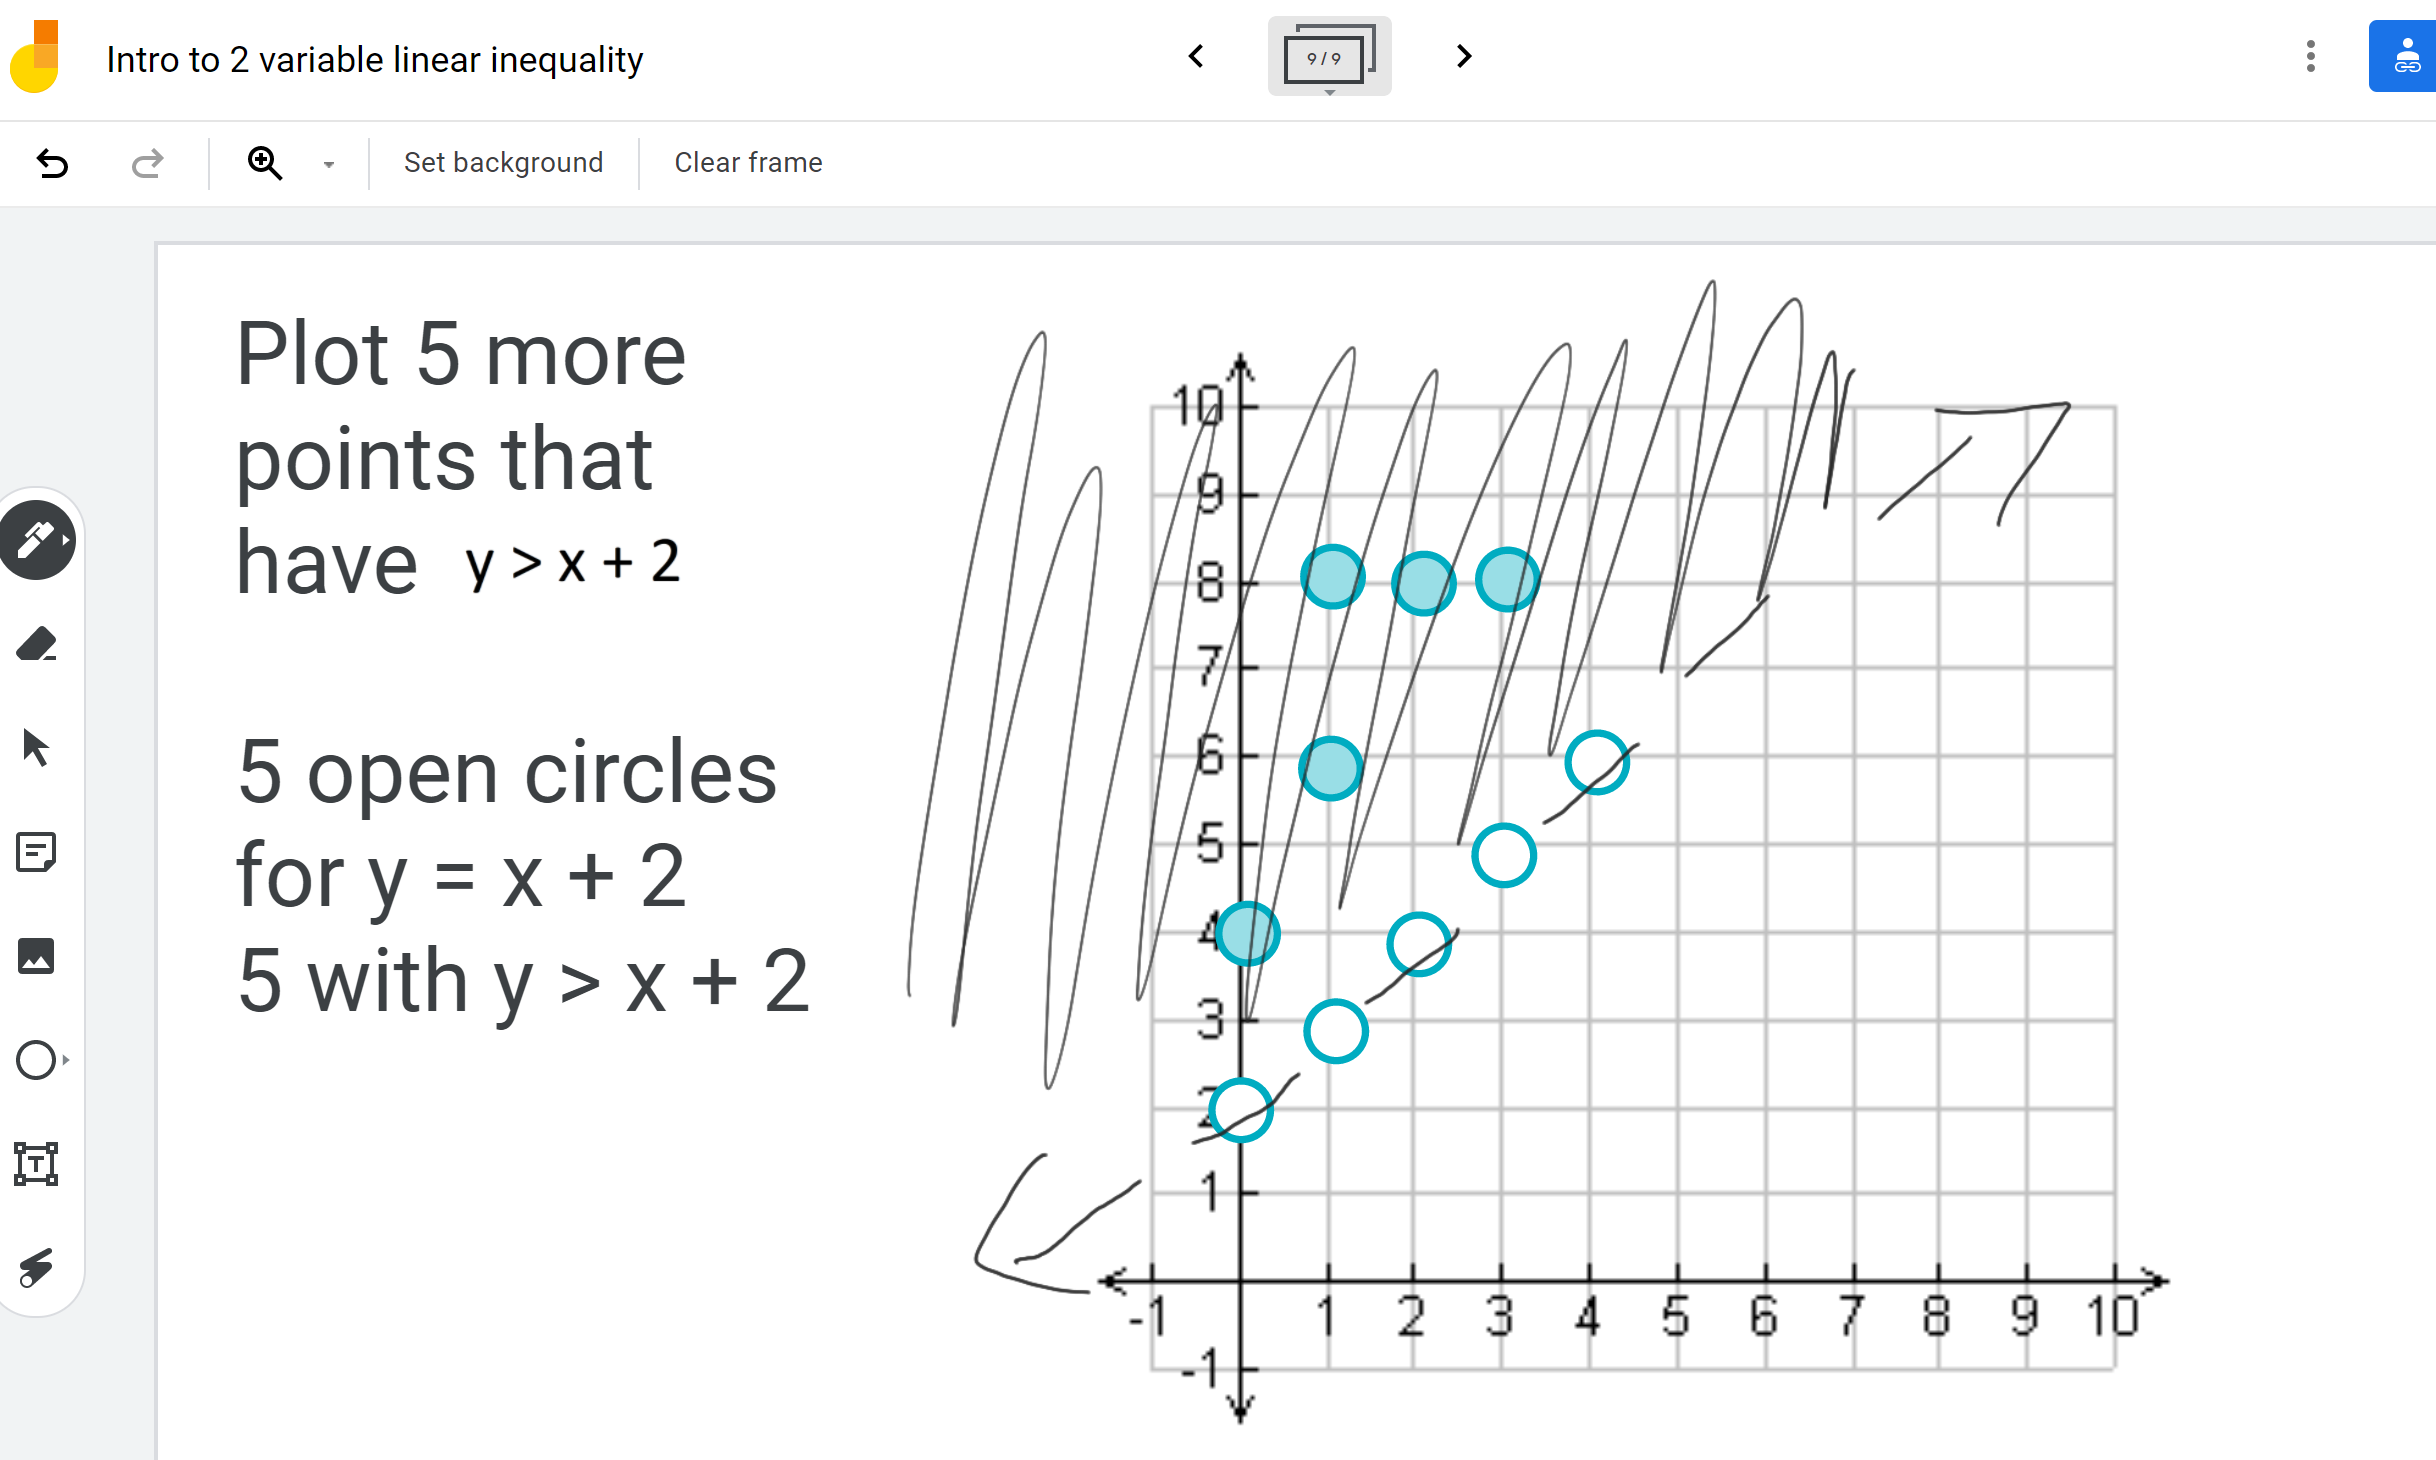
Previously, I shared how I use a Google Jamboard to introduce 1 variable linear equalities with a focus on conceptual understanding. I use the same approach for the 2 variable version (example problem below). A conceptual gap that typically arises is the students do not understand what the shading represents. This is what I am…
-
Graphing Linear Functions
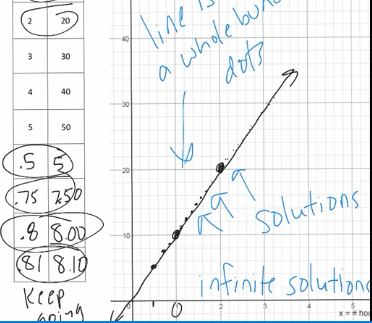
Graphing linear functions and the underlying concept are challenging for many students. The video below shows a scaffolded approach to teaching how to graph. This approach also addresses the concept of the graph as a visual representation of all possible solutions (see photo above). Students often do not realize that the line is actually comprised…