algebra
-
Intro to Graphing Linear Functions using Jamboard

Graphing linear functions may be the most important topic in Algebra 1. While proportional reasoning is a prelude to functions, this is the first formally identified function presented to them. The graphing leads to slope and intercepts, beyond the entry point for graphical representations to functions. This post presents an activity that can serve as…
-
Factoring Quadratics – Loh Method

Dr. Po-Shen Loh shared a possible new method for factoring a quadratic. This post provides a layman’s attempt to share the steps that teachers may find intriguing and possibly useful, especially for complex roots. Dr. Loh’s Website Here is a link to a page on his site that provides his explanation. Factoring Background In the…
-
Systems Word Problems Scaffolded
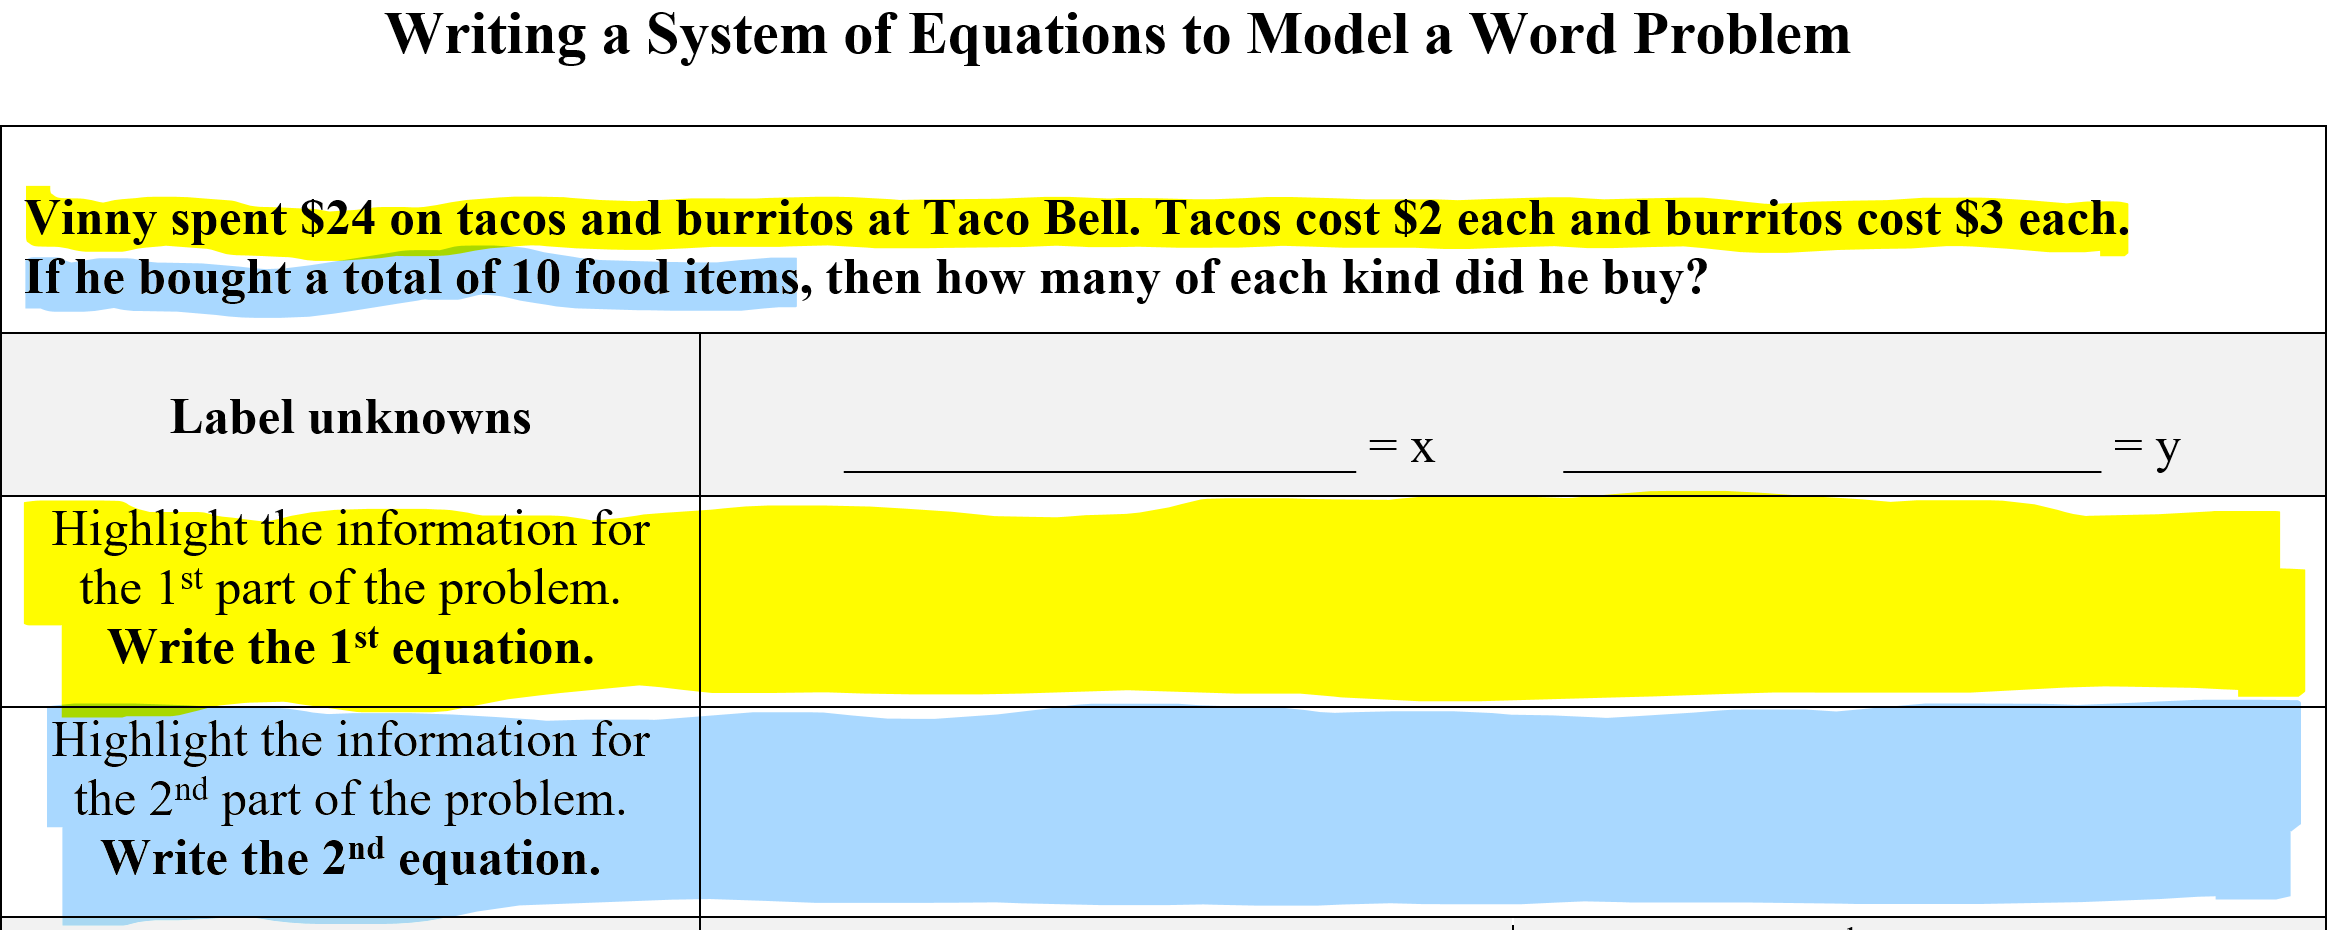
Word problems are challenging for many students. Writing a system of equations to model a word problem has unique challenges. This post provides details about a scaffolded handout with color coding can unpack the process for generating the appropriate system of equations. Unpacking the Word Problem A mistake I have witnessed over the years is…
-
Variable Both Sides Equations Scaffolded

Solving the variable on both sides is the Cerberus of 1 variable linear equations. It has multiple steps, simplifying expressions, and eliminating a variable expression. The later is a new step, added on to all the other steps. This post describes a scaffolded handout to guide students through the mental steps and the written steps.…
-
Solving 2-Step Equation Scaffolded
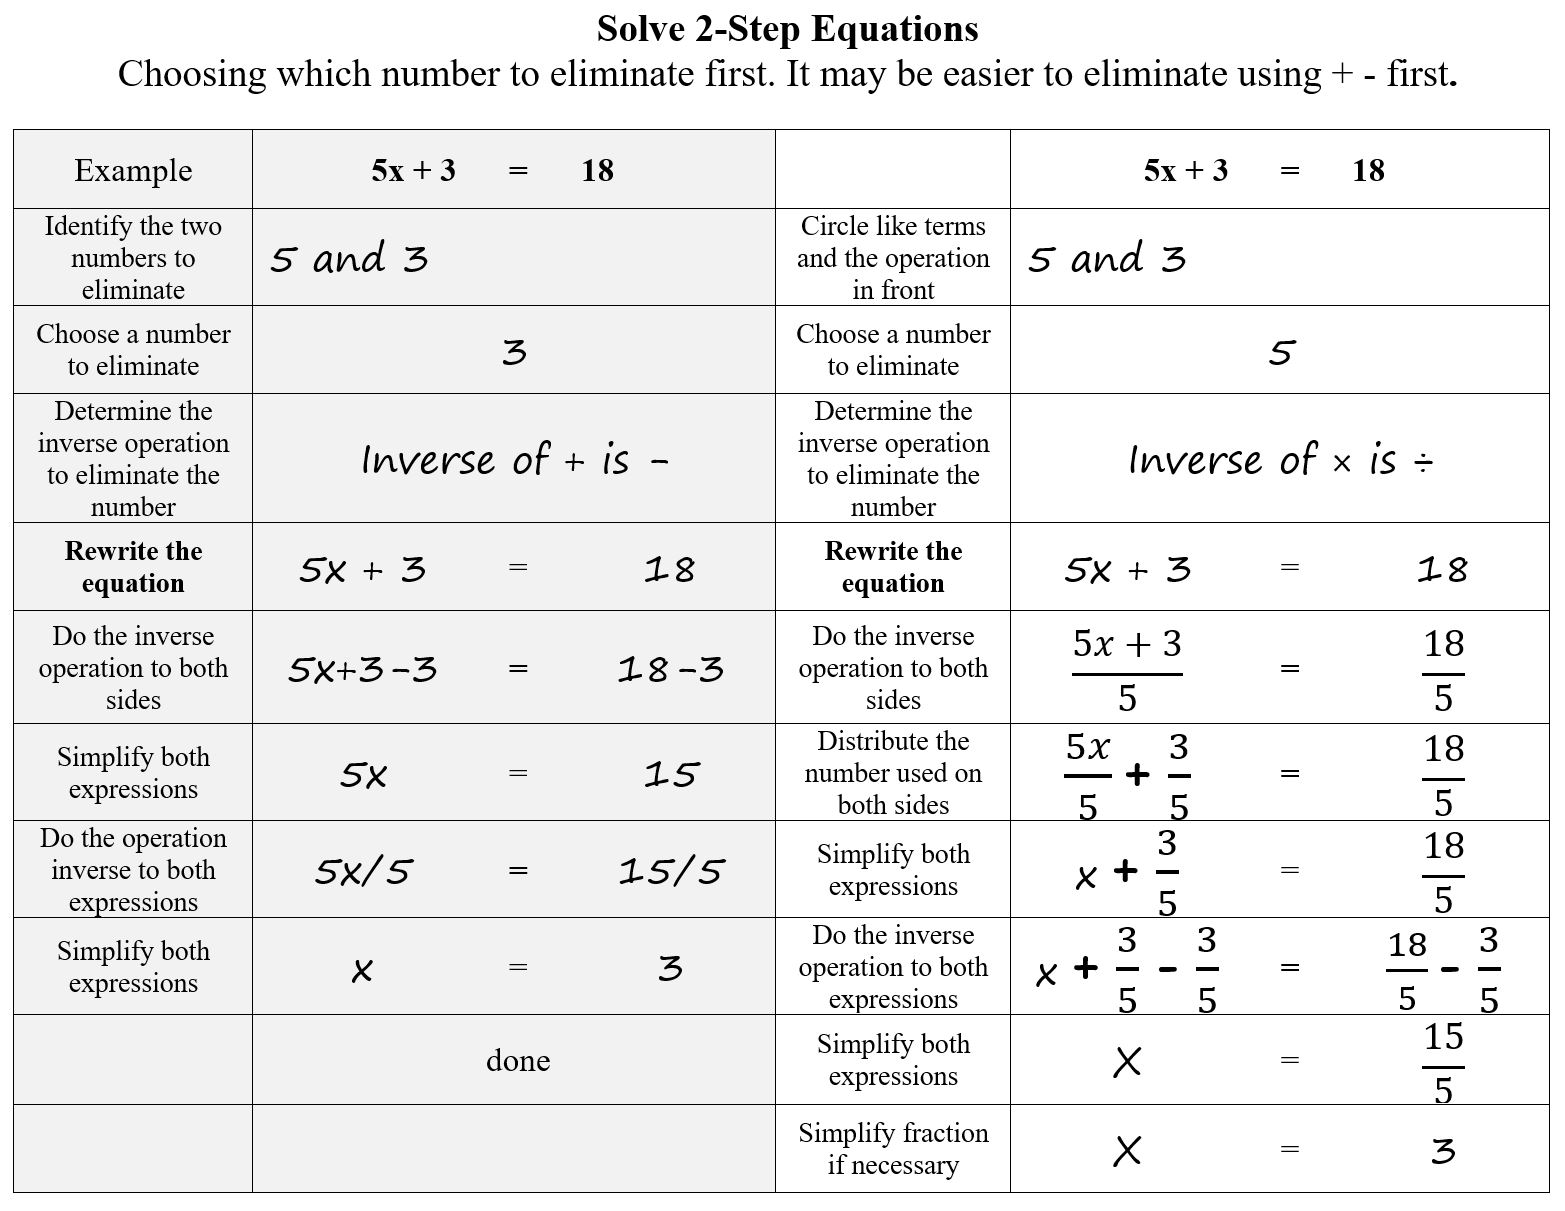
Solving 2-step Equations is an escalation in terms of task demand. Starting in elementary school, they are exposed to math sentences in which there is a single operation. Now they are asked to choose a number to eliminate. This post provides details about a scaffolded handout. It addresses the choice of number to eliminate and…
-
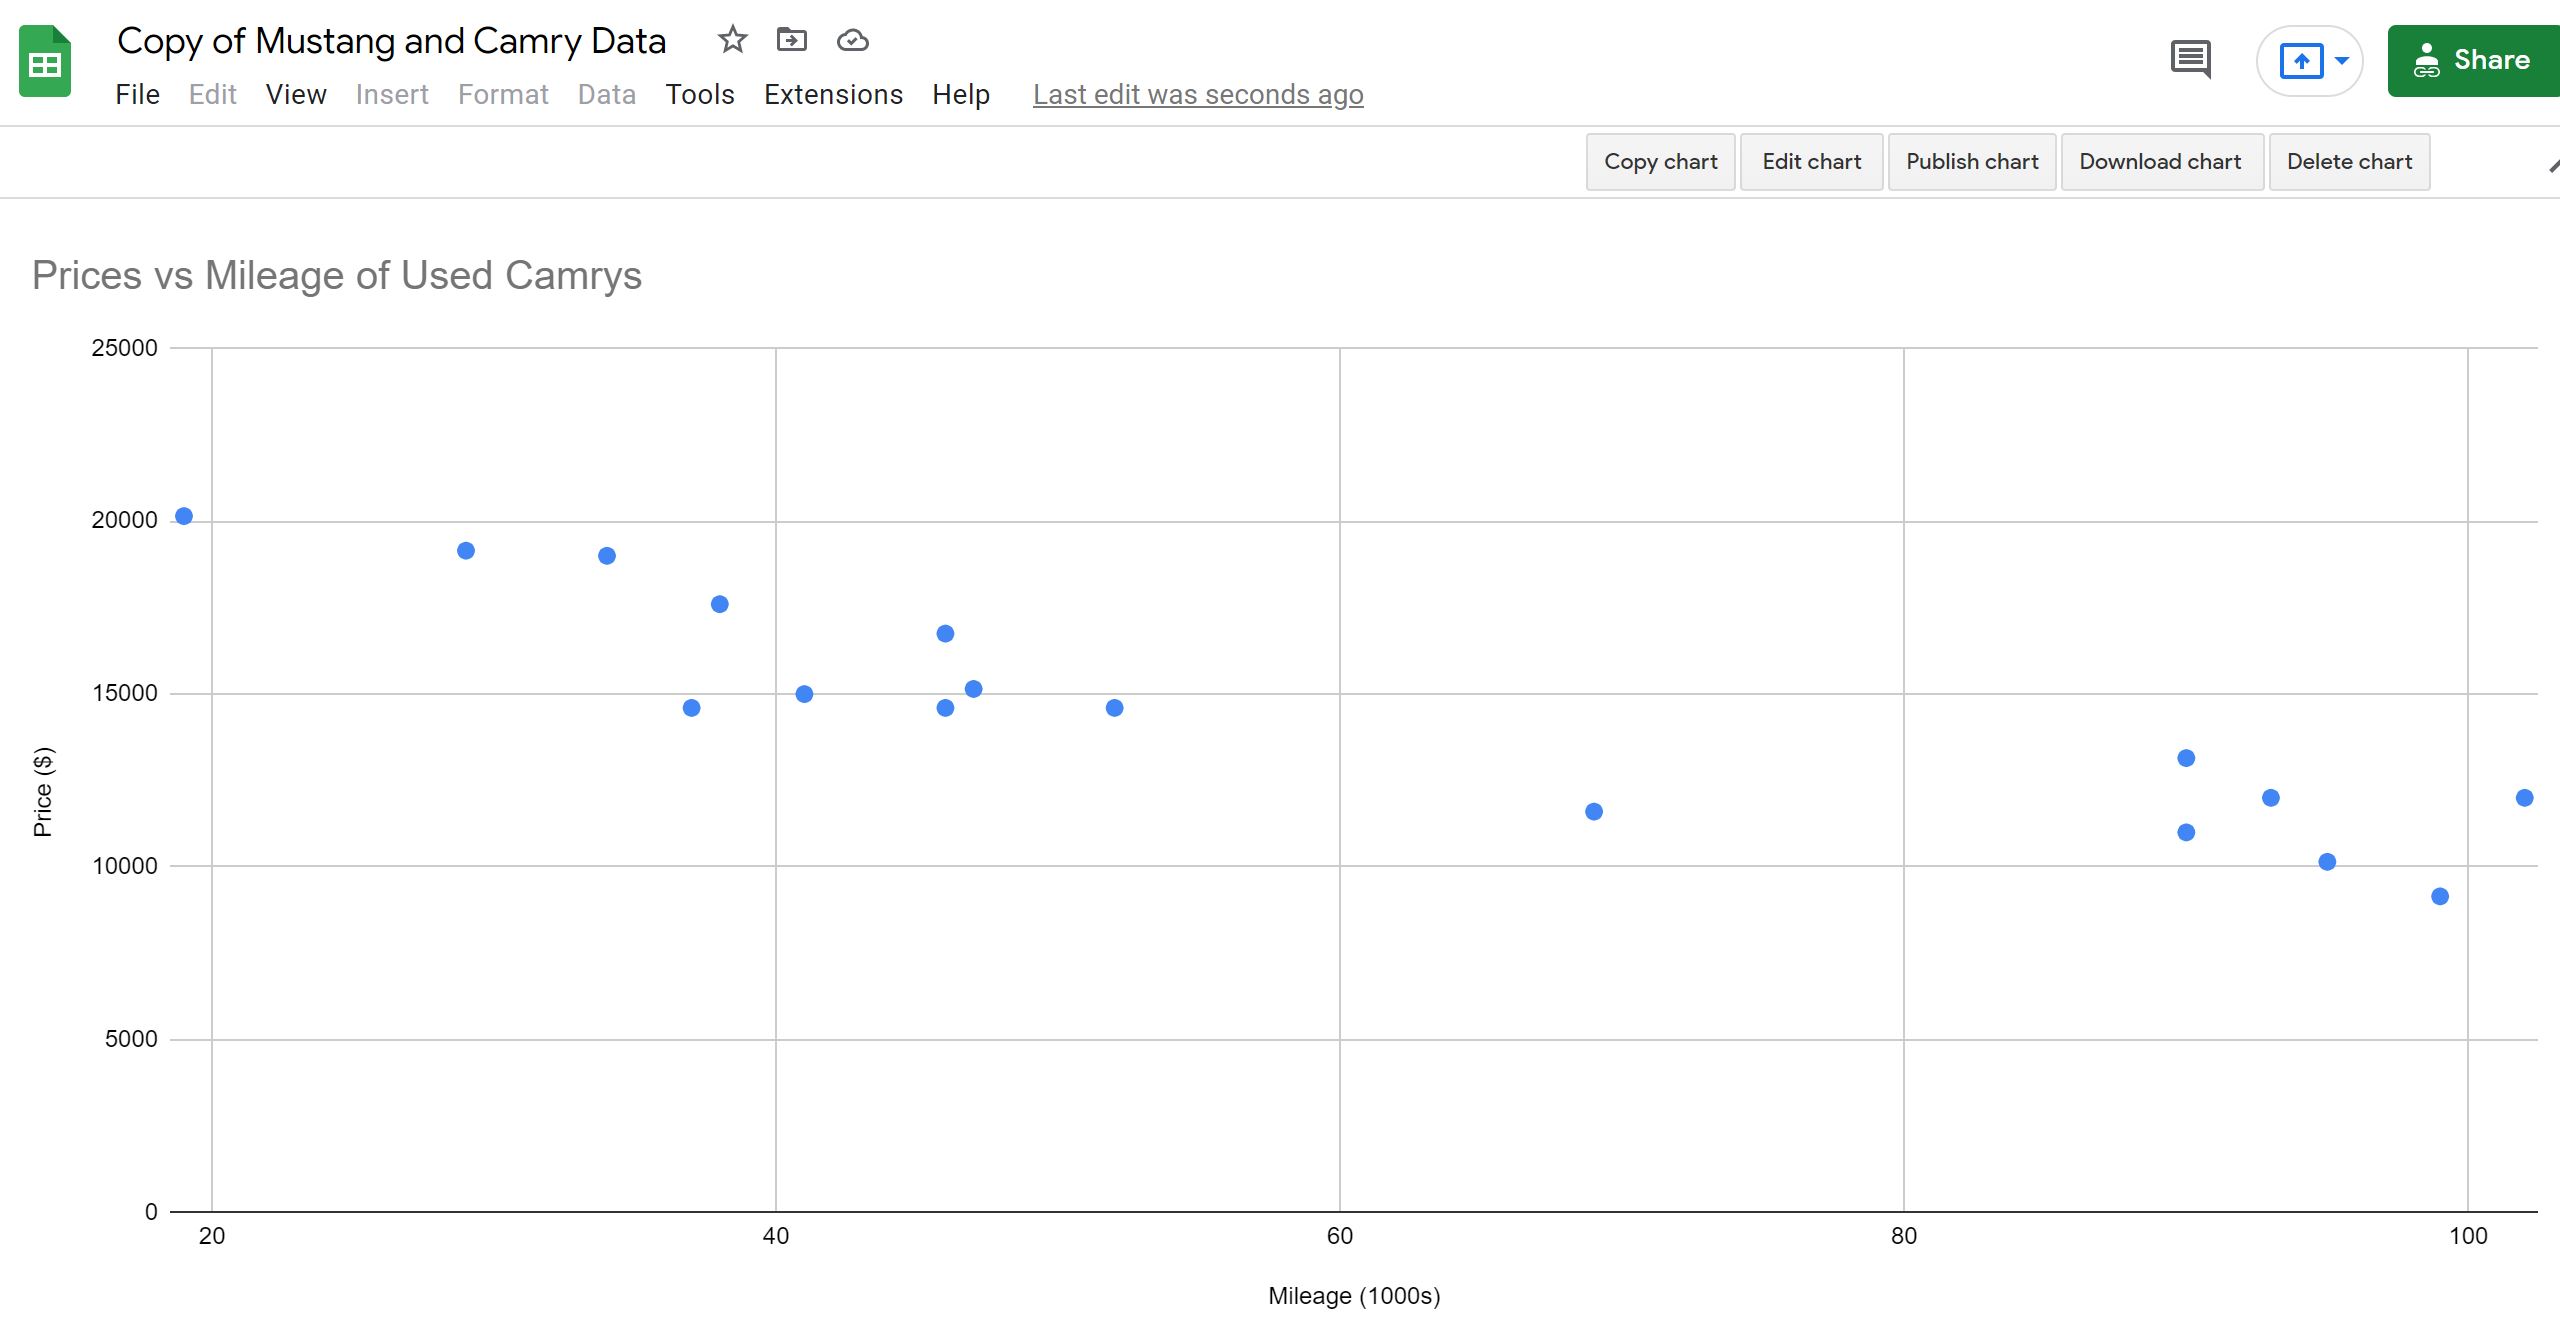
Introduction to Scatter Plots with Google Sheets
-
Unpacking Graphs Using a Rollercoaster

I introduce key characteristics with parabolas and use the analogy of a rollercoaster. Riding once (and never a again) the Superman rollercoaster at Six Flags New England got me thinking about this. At one point the roller coaster hits ground level (a zero) and then goes underground (negative y values). Handout Here is a handout…
-
Introduction to Key Characteristics of Graphs Using a Rollercoaster
I introduce key characteristics with parabolas and use the analogy of a rollercoaster. Riding once (and never a again) the Superman rollercoaster at Six Flags New England got me thinking about this. At one point the rollercaster hits ground level (a zero) and then goes underground (negative y values). Here is a handout I use…
-
Intro Linear & Proportional Relationship

This post provides a handout to introduce linear functions and proportional relationships. Multiple instructional strategies are implemented. There is context that draws upon prior knowledge, scaffolding, and visual representations. Graph and table representations of the functions are used as an entry point, without the use of equations. Overview There is a difference between proportional relationships…
-
Intro to Linear Functions and Proportionality Equations Using Context, Tables, and Graphs.