Connections to Prior Knowledge
-
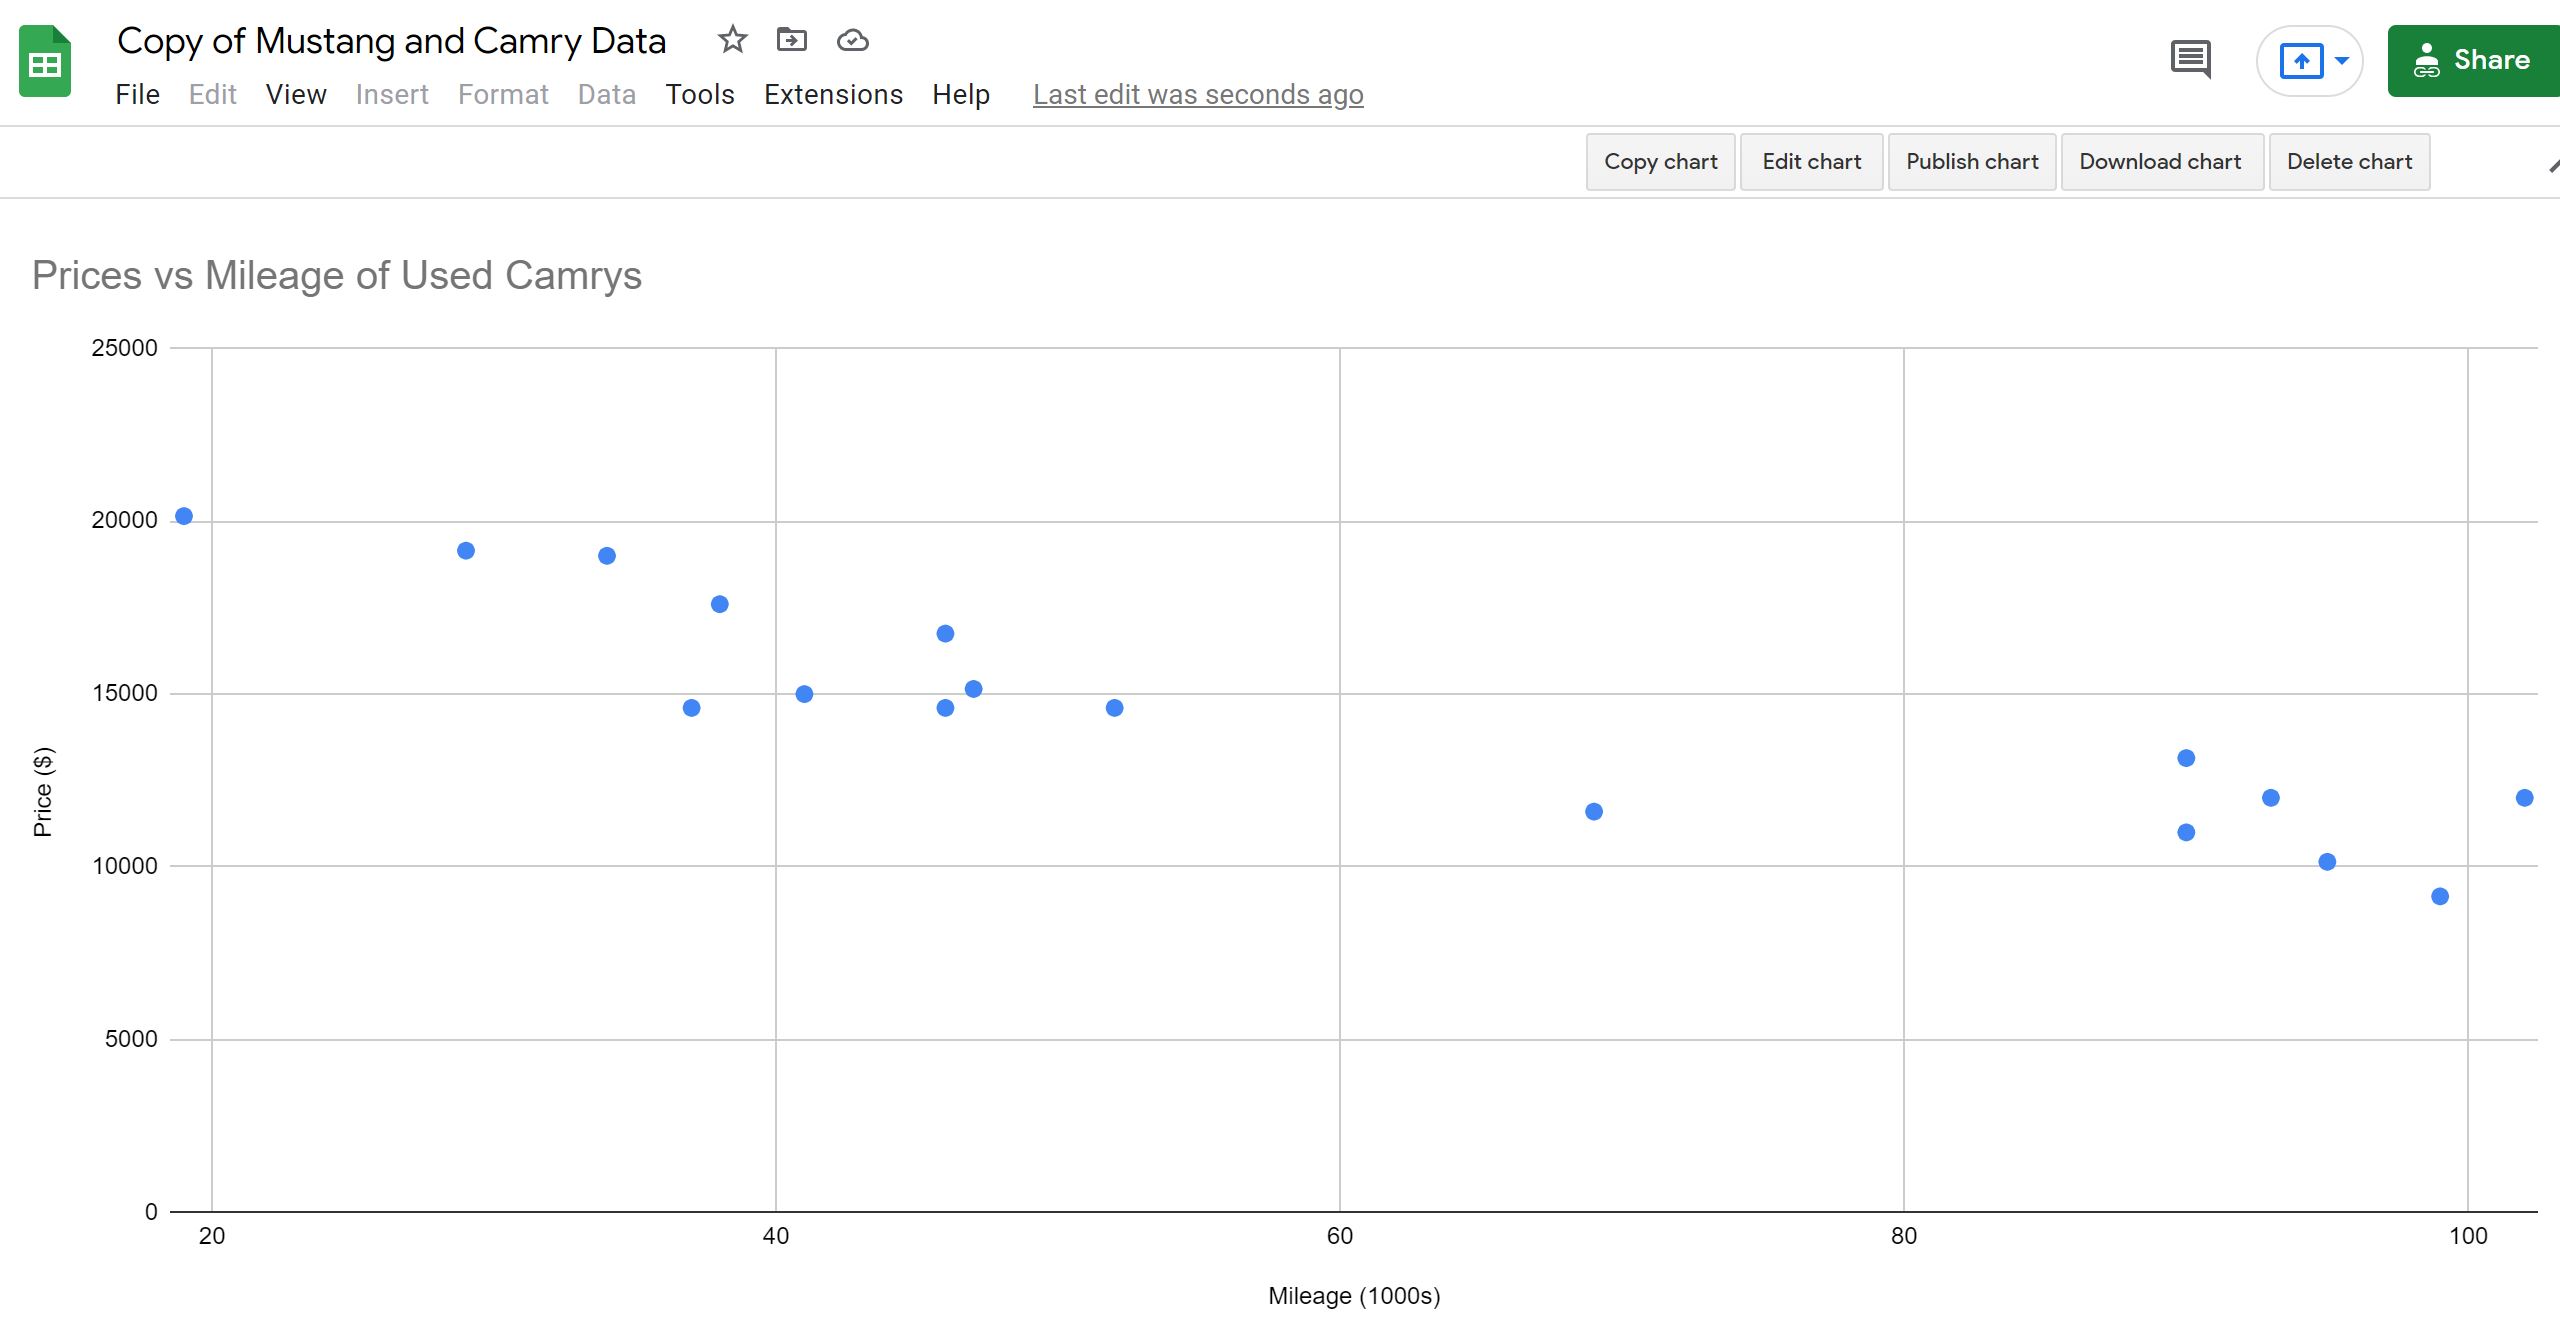
Introduction to Scatter Plots with Google Sheets
-
Rounding to Nearest 10 with Scaffolding Faded
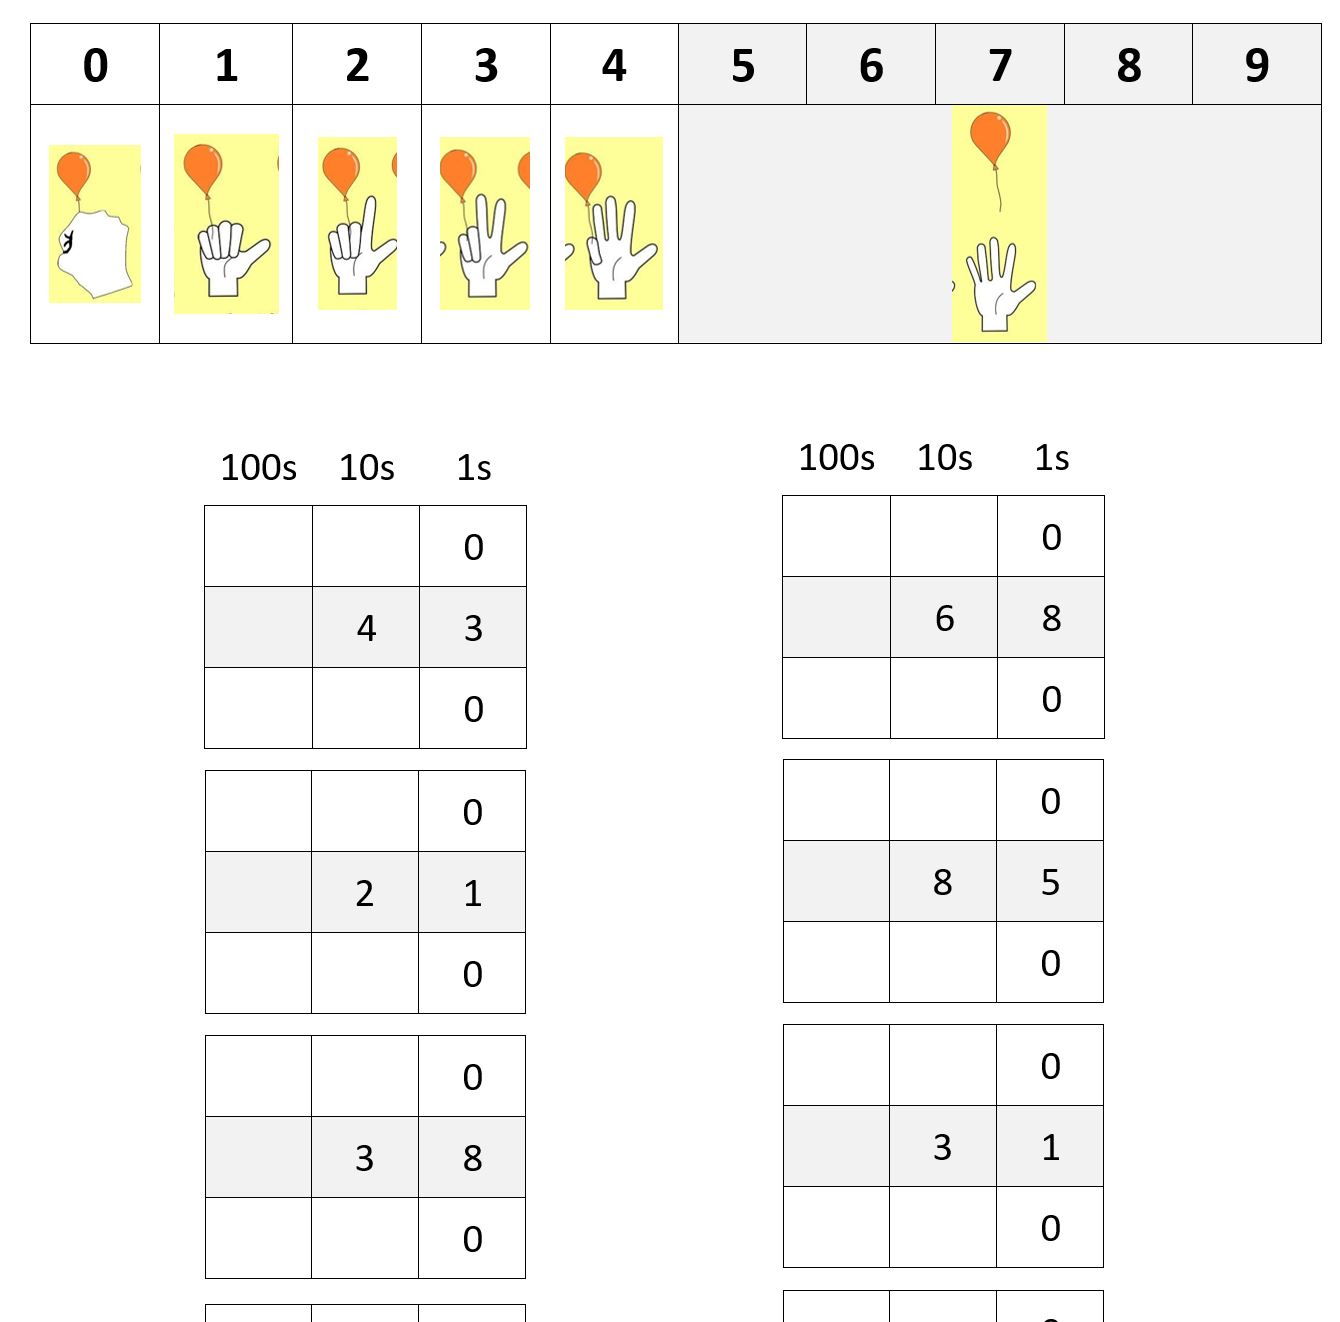
The first page has maximum scaffolding with the student focusing only on which tens to round to. In turn, an a different element is the focus (e.g., writing the 0s then rounding) and then the scaffolding is increasingly faded. Here is a link to a WORD document so you can change numbers AND add digits…
-
Rounding with Scaffolded Handout
This post shows an approach to teach rounding to the nearest 10 and is presented on a handout. Multiple strategies are used. This includes scaffolding, chunking with supports incrementally faded, and a visual. Overview A visual of the hand releasing the balloon draws upon prior knowledge and provides a mnemonic for when to round up.…
-
Introduction to Key Characteristics of Graphs Using a Rollercoaster

I introduce key characteristics with parabolas and use the analogy of a rollercoaster. Riding once (and never a again) the Superman rollercoaster at Six Flags New England got me thinking about this. At one point the rollercaster hits ground level (a zero) and then goes underground (negative y values). Here is a handout I use…
-
Unpacking Graphs Using a Rollercoaster
I introduce key characteristics with parabolas and use the analogy of a rollercoaster. Riding once (and never a again) the Superman rollercoaster at Six Flags New England got me thinking about this. At one point the roller coaster hits ground level (a zero) and then goes underground (negative y values). Handout Here is a handout…
-
Intro to Linear Functions and Proportionality Equations Using Context, Tables, and Graphs.

-
Intro Linear & Proportional Relationship
This post provides a handout to introduce linear functions and proportional relationships. Multiple instructional strategies are implemented. There is context that draws upon prior knowledge, scaffolding, and visual representations. Graph and table representations of the functions are used as an entry point, without the use of equations. Overview There is a difference between proportional relationships…
-
Introduction to Intercepts – Mini-lesson with Scaffolded Section for Computing
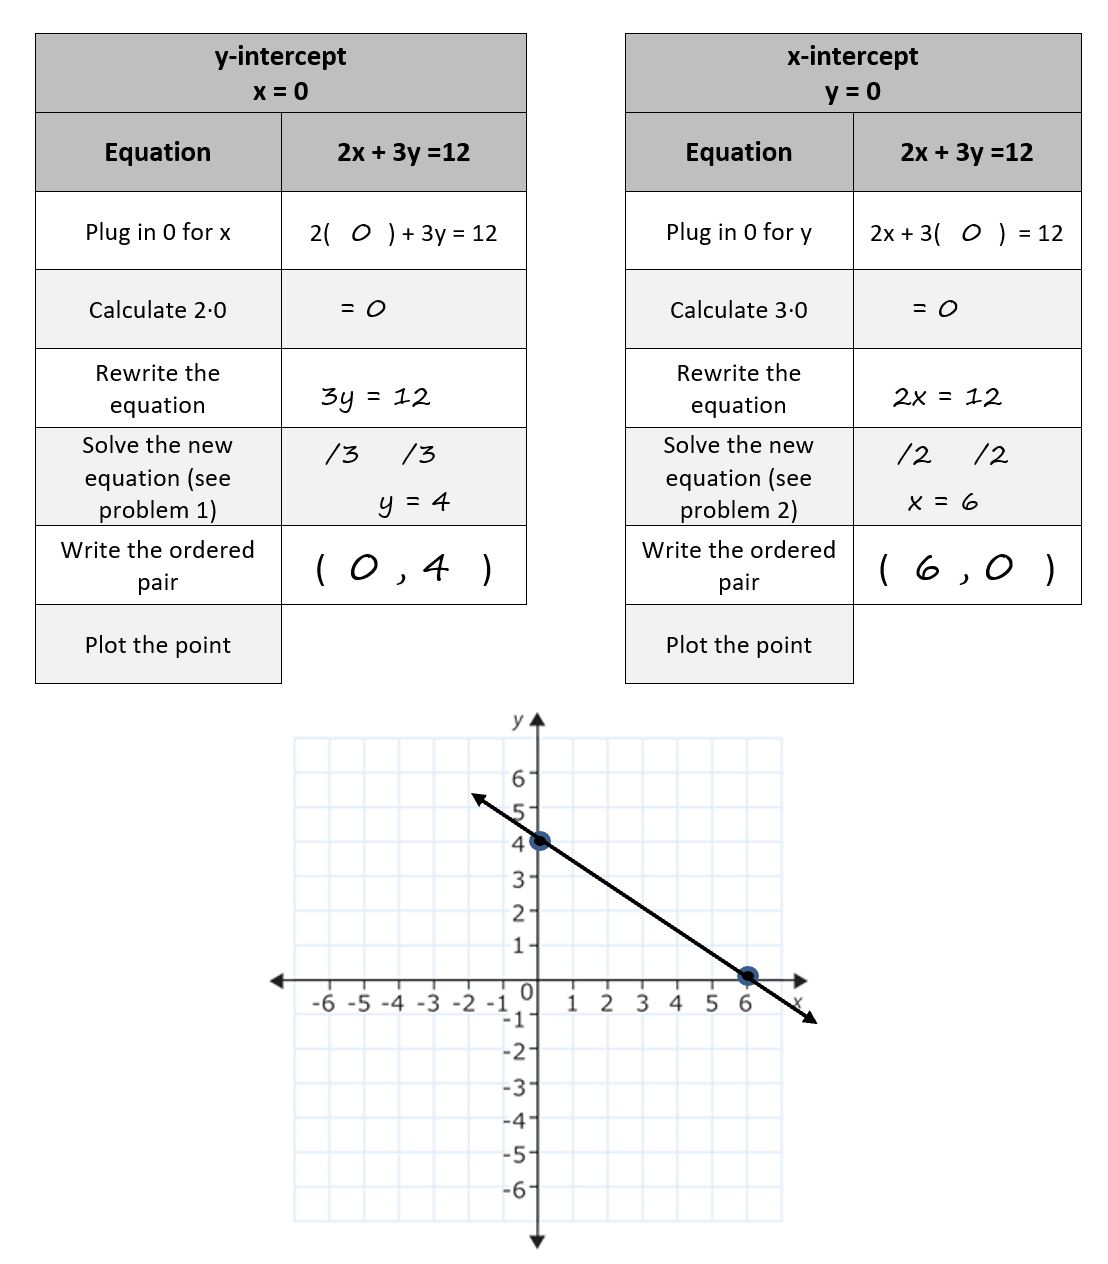
Here is a link to the document, with images showing the notes. This is a mini-lesson with the following components. A fill in the blank for writing the lesson objective. A Do now which serves as an initiation to the lesson. The y-intercept can be discussed in the context of buying 0 slices of pizza…
-
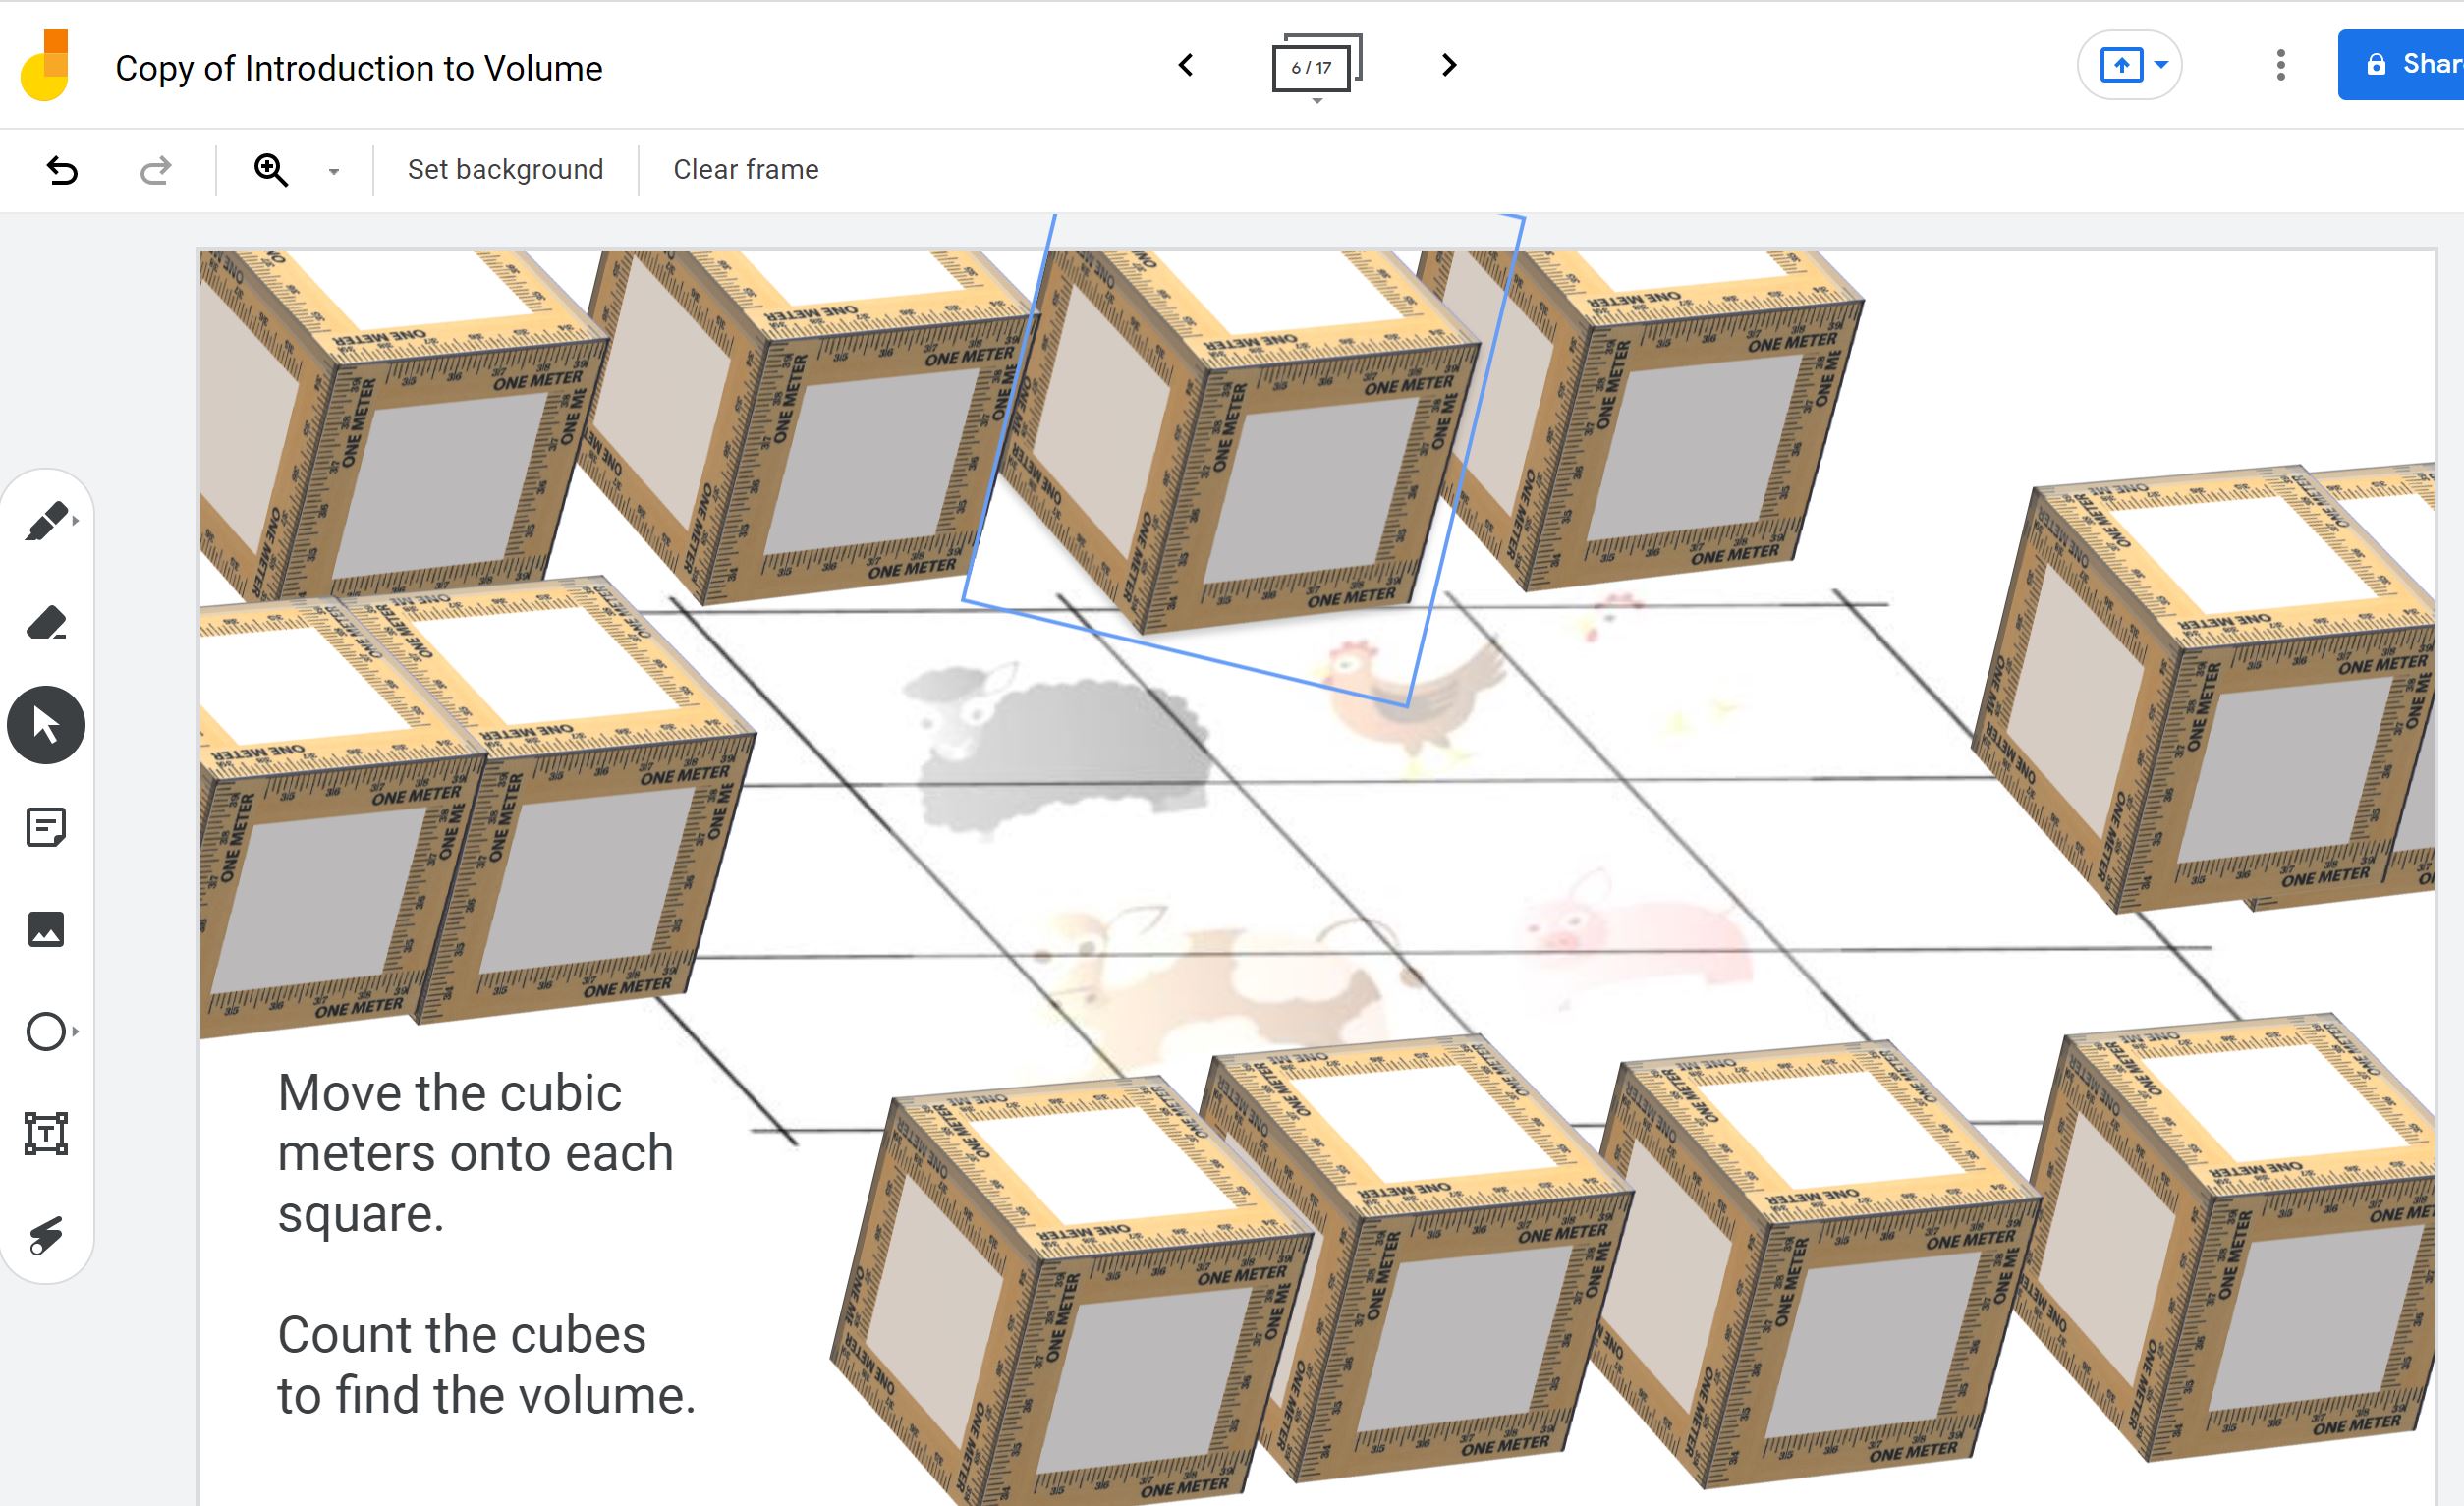
Introduction to Volume – Manipulatives (starting with perimeter and area)
-
Intro to Solving Equations – Seesaws and Oranges
