prior knowledge
-
Introduction to Adding Integers

Operations on integers and integers in general is challenging for many students. Negative numbers are abstract. Whole numbers and fractions can be represented with images. The activity presented draws upon student prior knowledge of thumbs up and down in a vote to make negative more accessible. The following images are from a Jamboard. Here are…
-
Equal Parts of Fractions – Intro
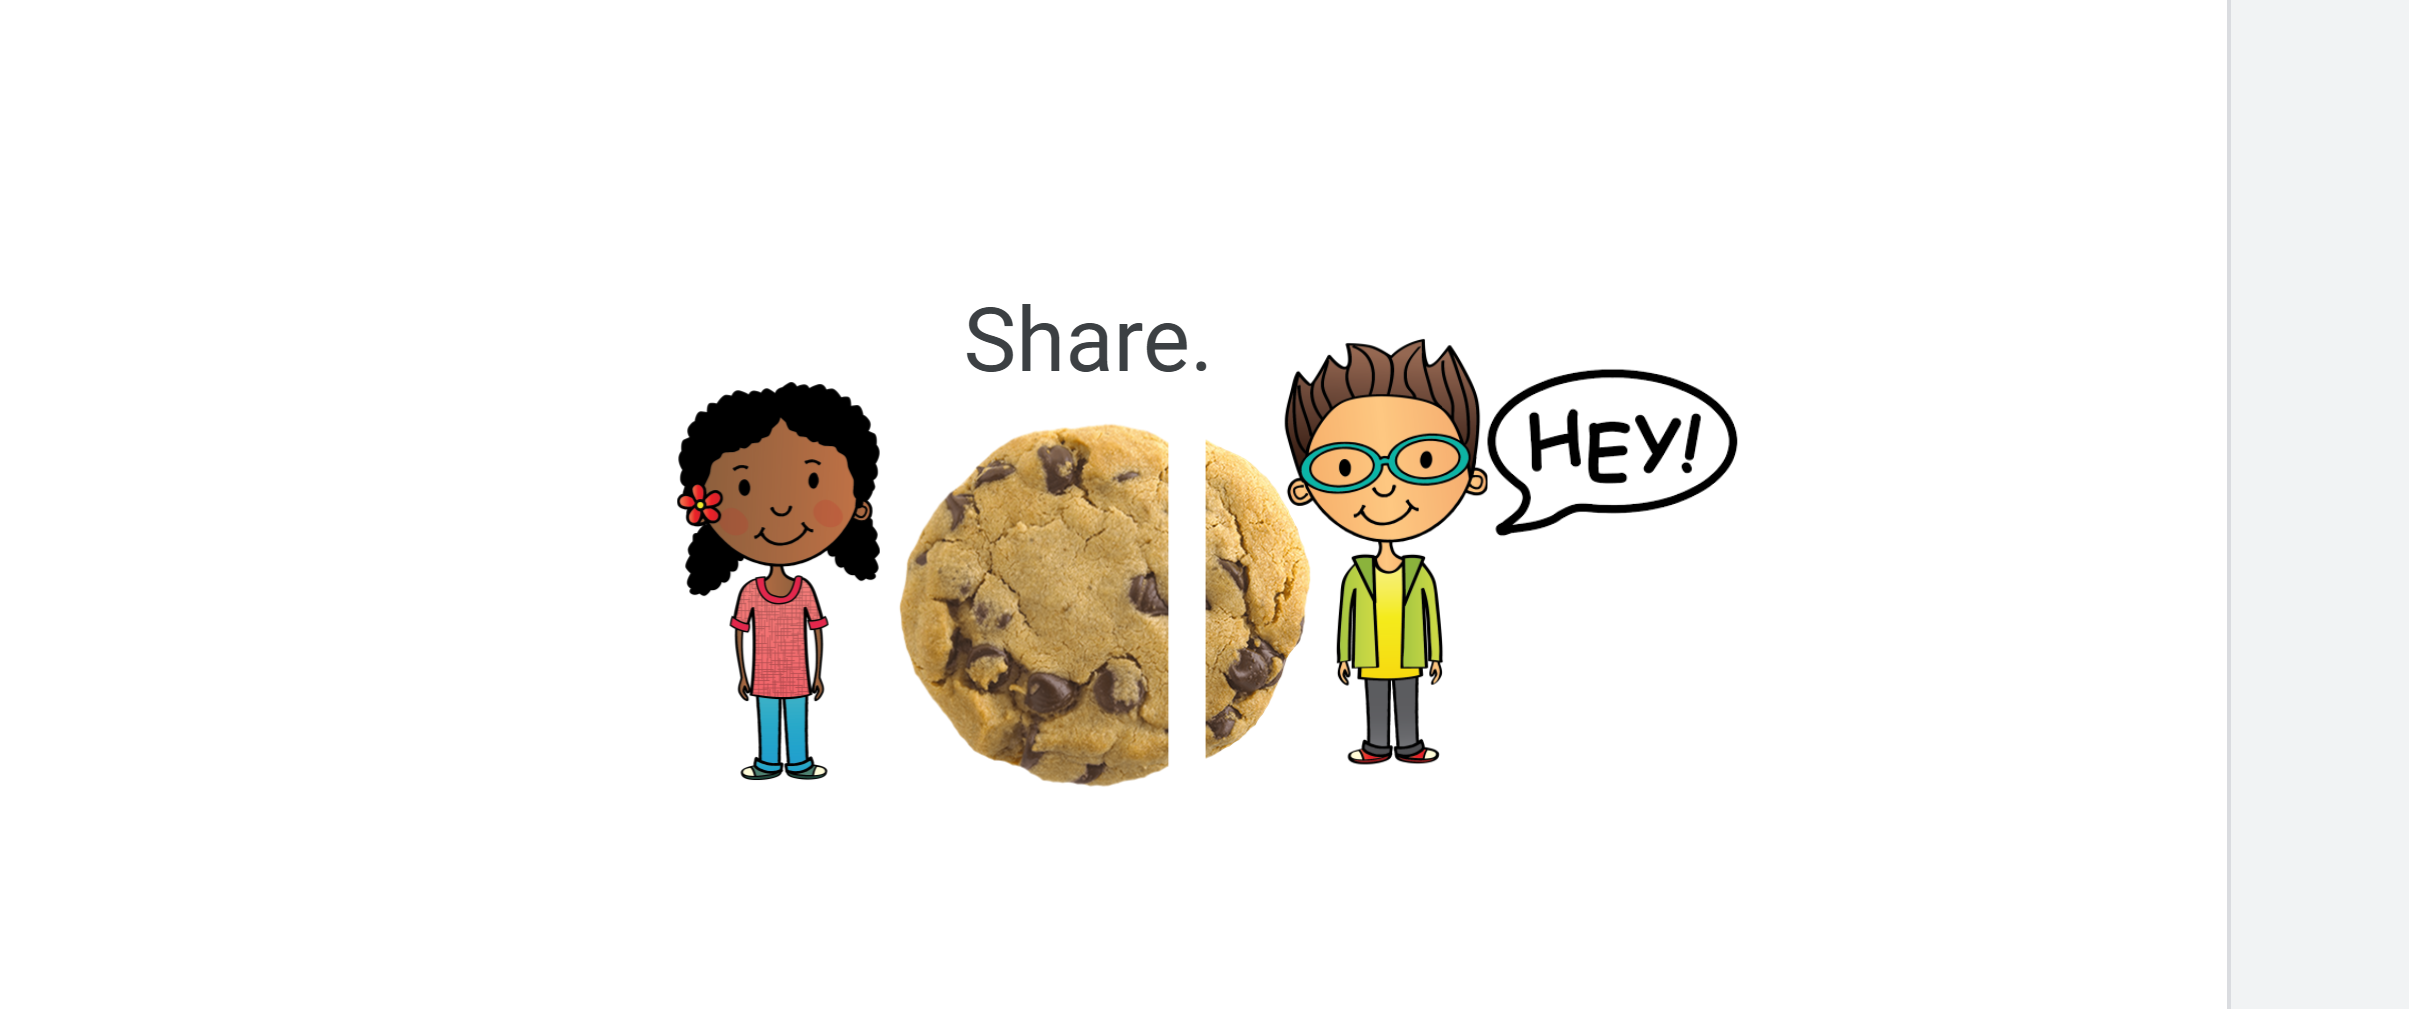
The concept of fractions as some number of equal parts begins in 1st grade per the Common Core (image below). There are students who struggle with the idea of equal parts and this could undermine student work in subsequent topics. The activity cited in this post is designed to develop the concept of equal parts.…
-
Intro to Slope of a Line

-
Speeding Up and Slowing Down on a Graph looking at Velocity and Acceleration
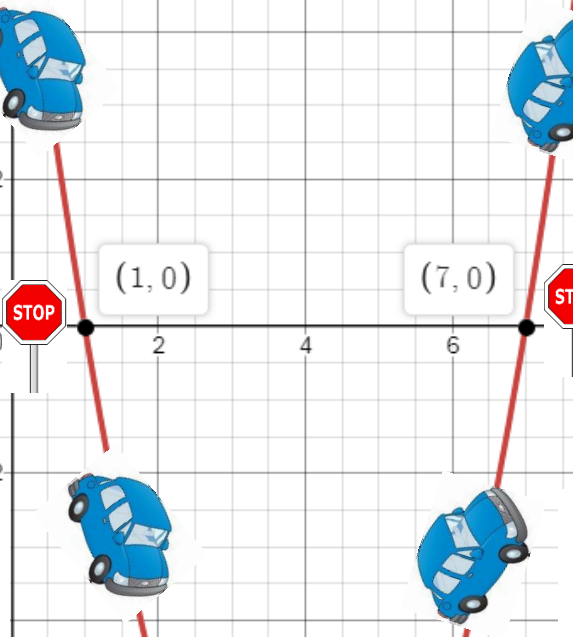
We all understand speed intuitively. Velocity and acceleration are more mathy and harder for many students to comprehend, especially on a graph. Even harder is the idea of when an object is slowing down or speeding up. In this post I attempt to unpack both. Velocity is speed with a direction. Negative in this case…
-
Intro to Multiplication – A Sequence of Lessons
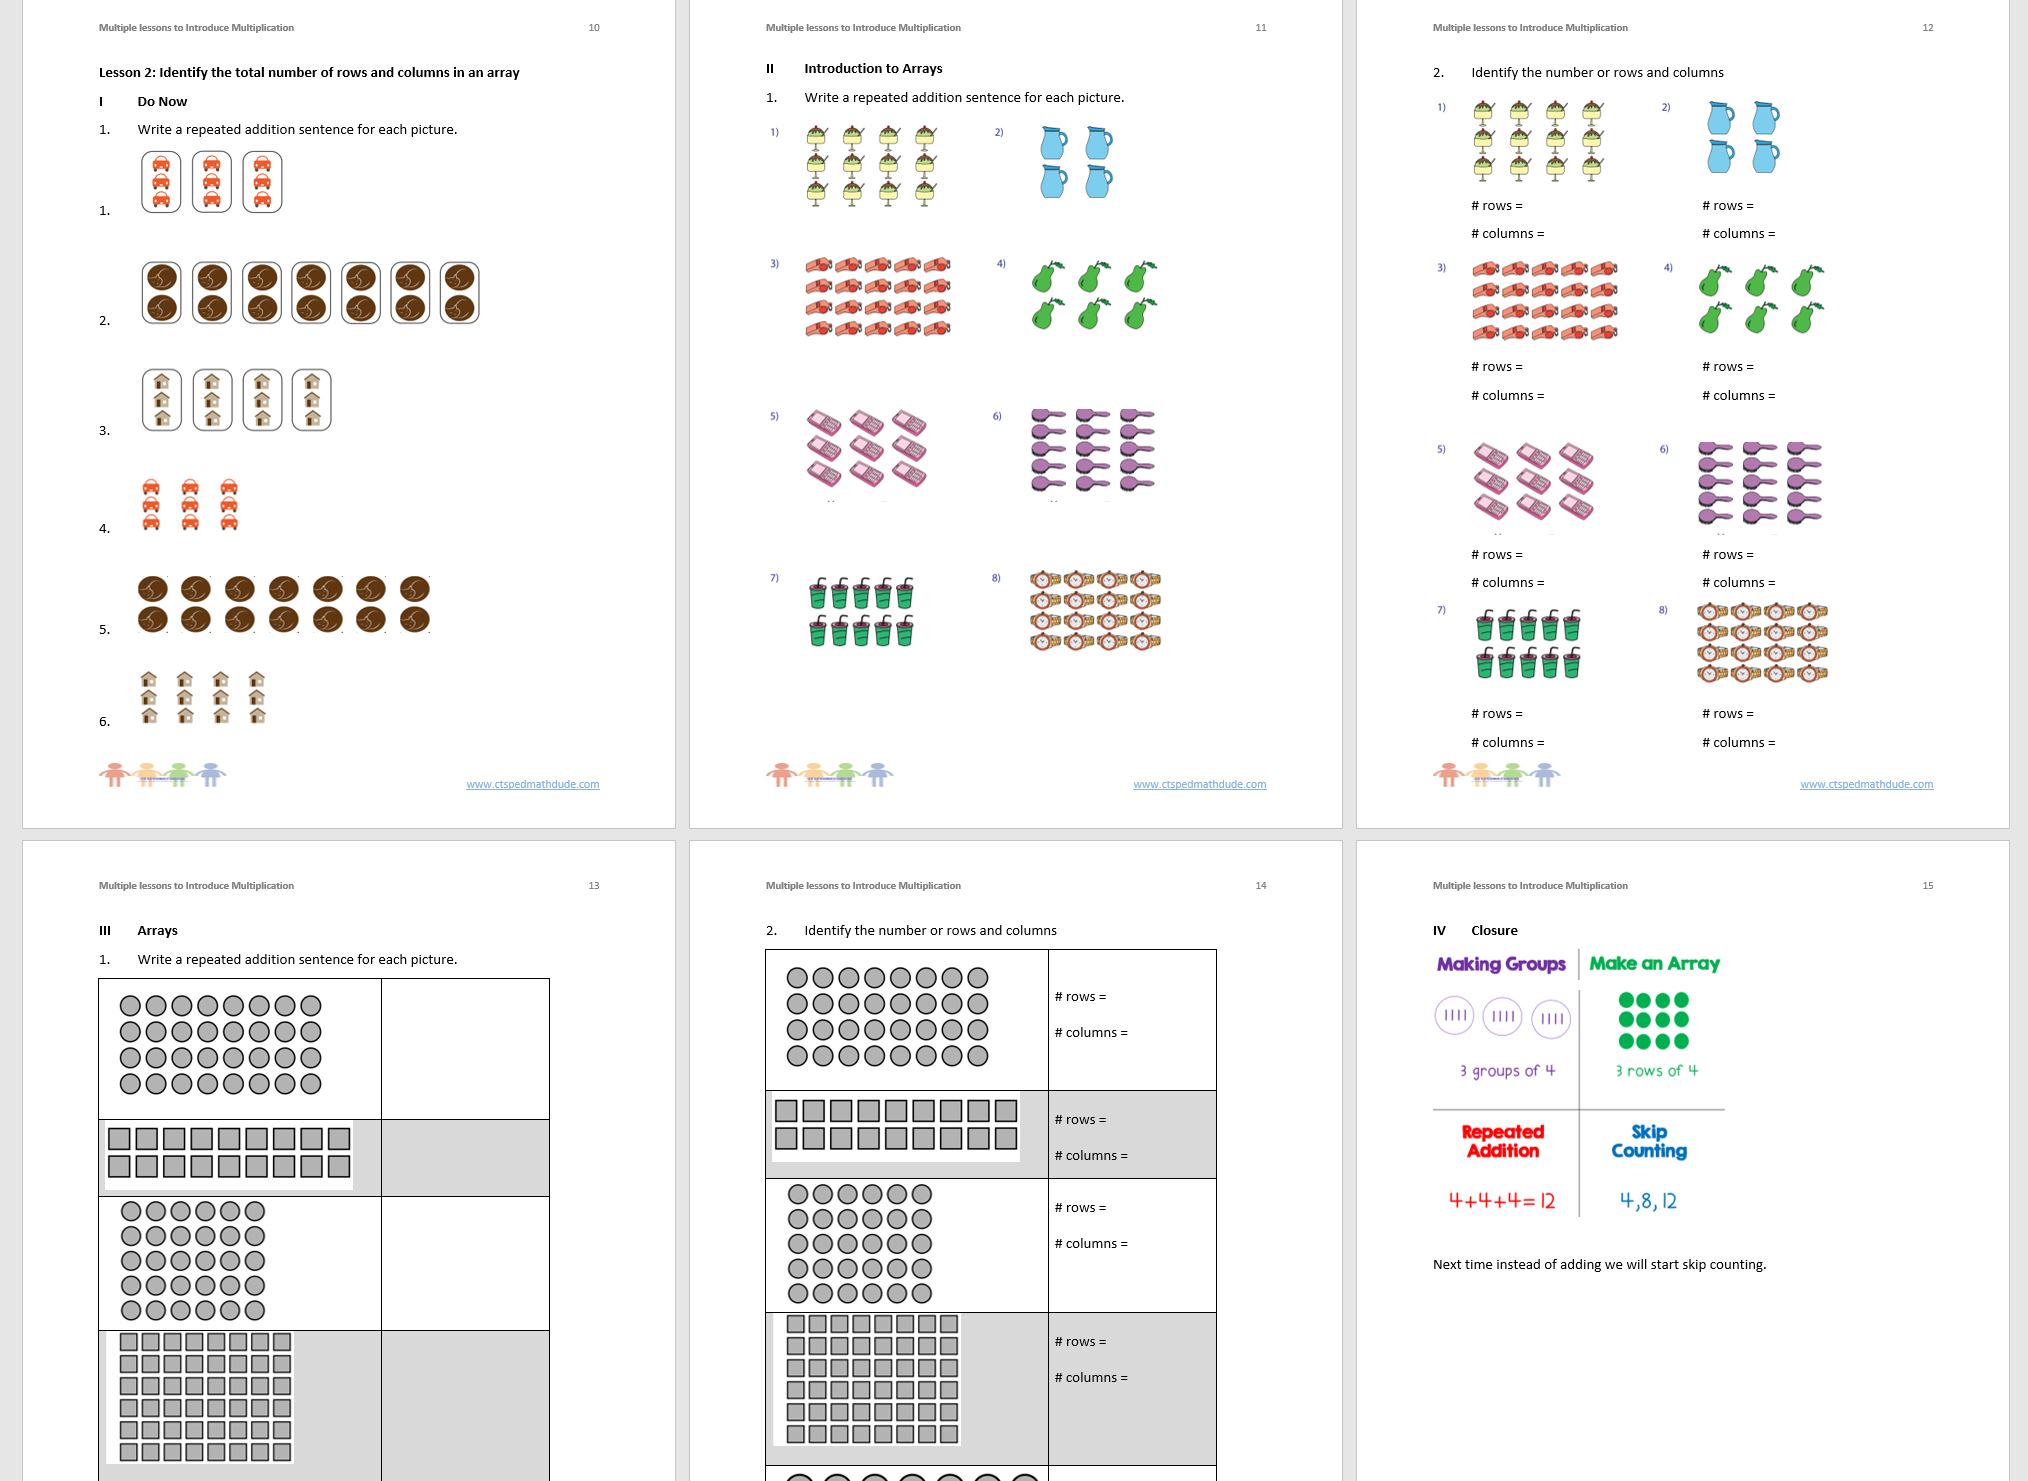
Below are photos from multiple lessons to introduce multiplication. They are combined into a single document. I use a task analysis approach to first develop conceptual understanding of multiplication as repeated addition. This is followed by skip counting and then using skip counting to multiply. The lessons are not necessary completed in a single day.…
-
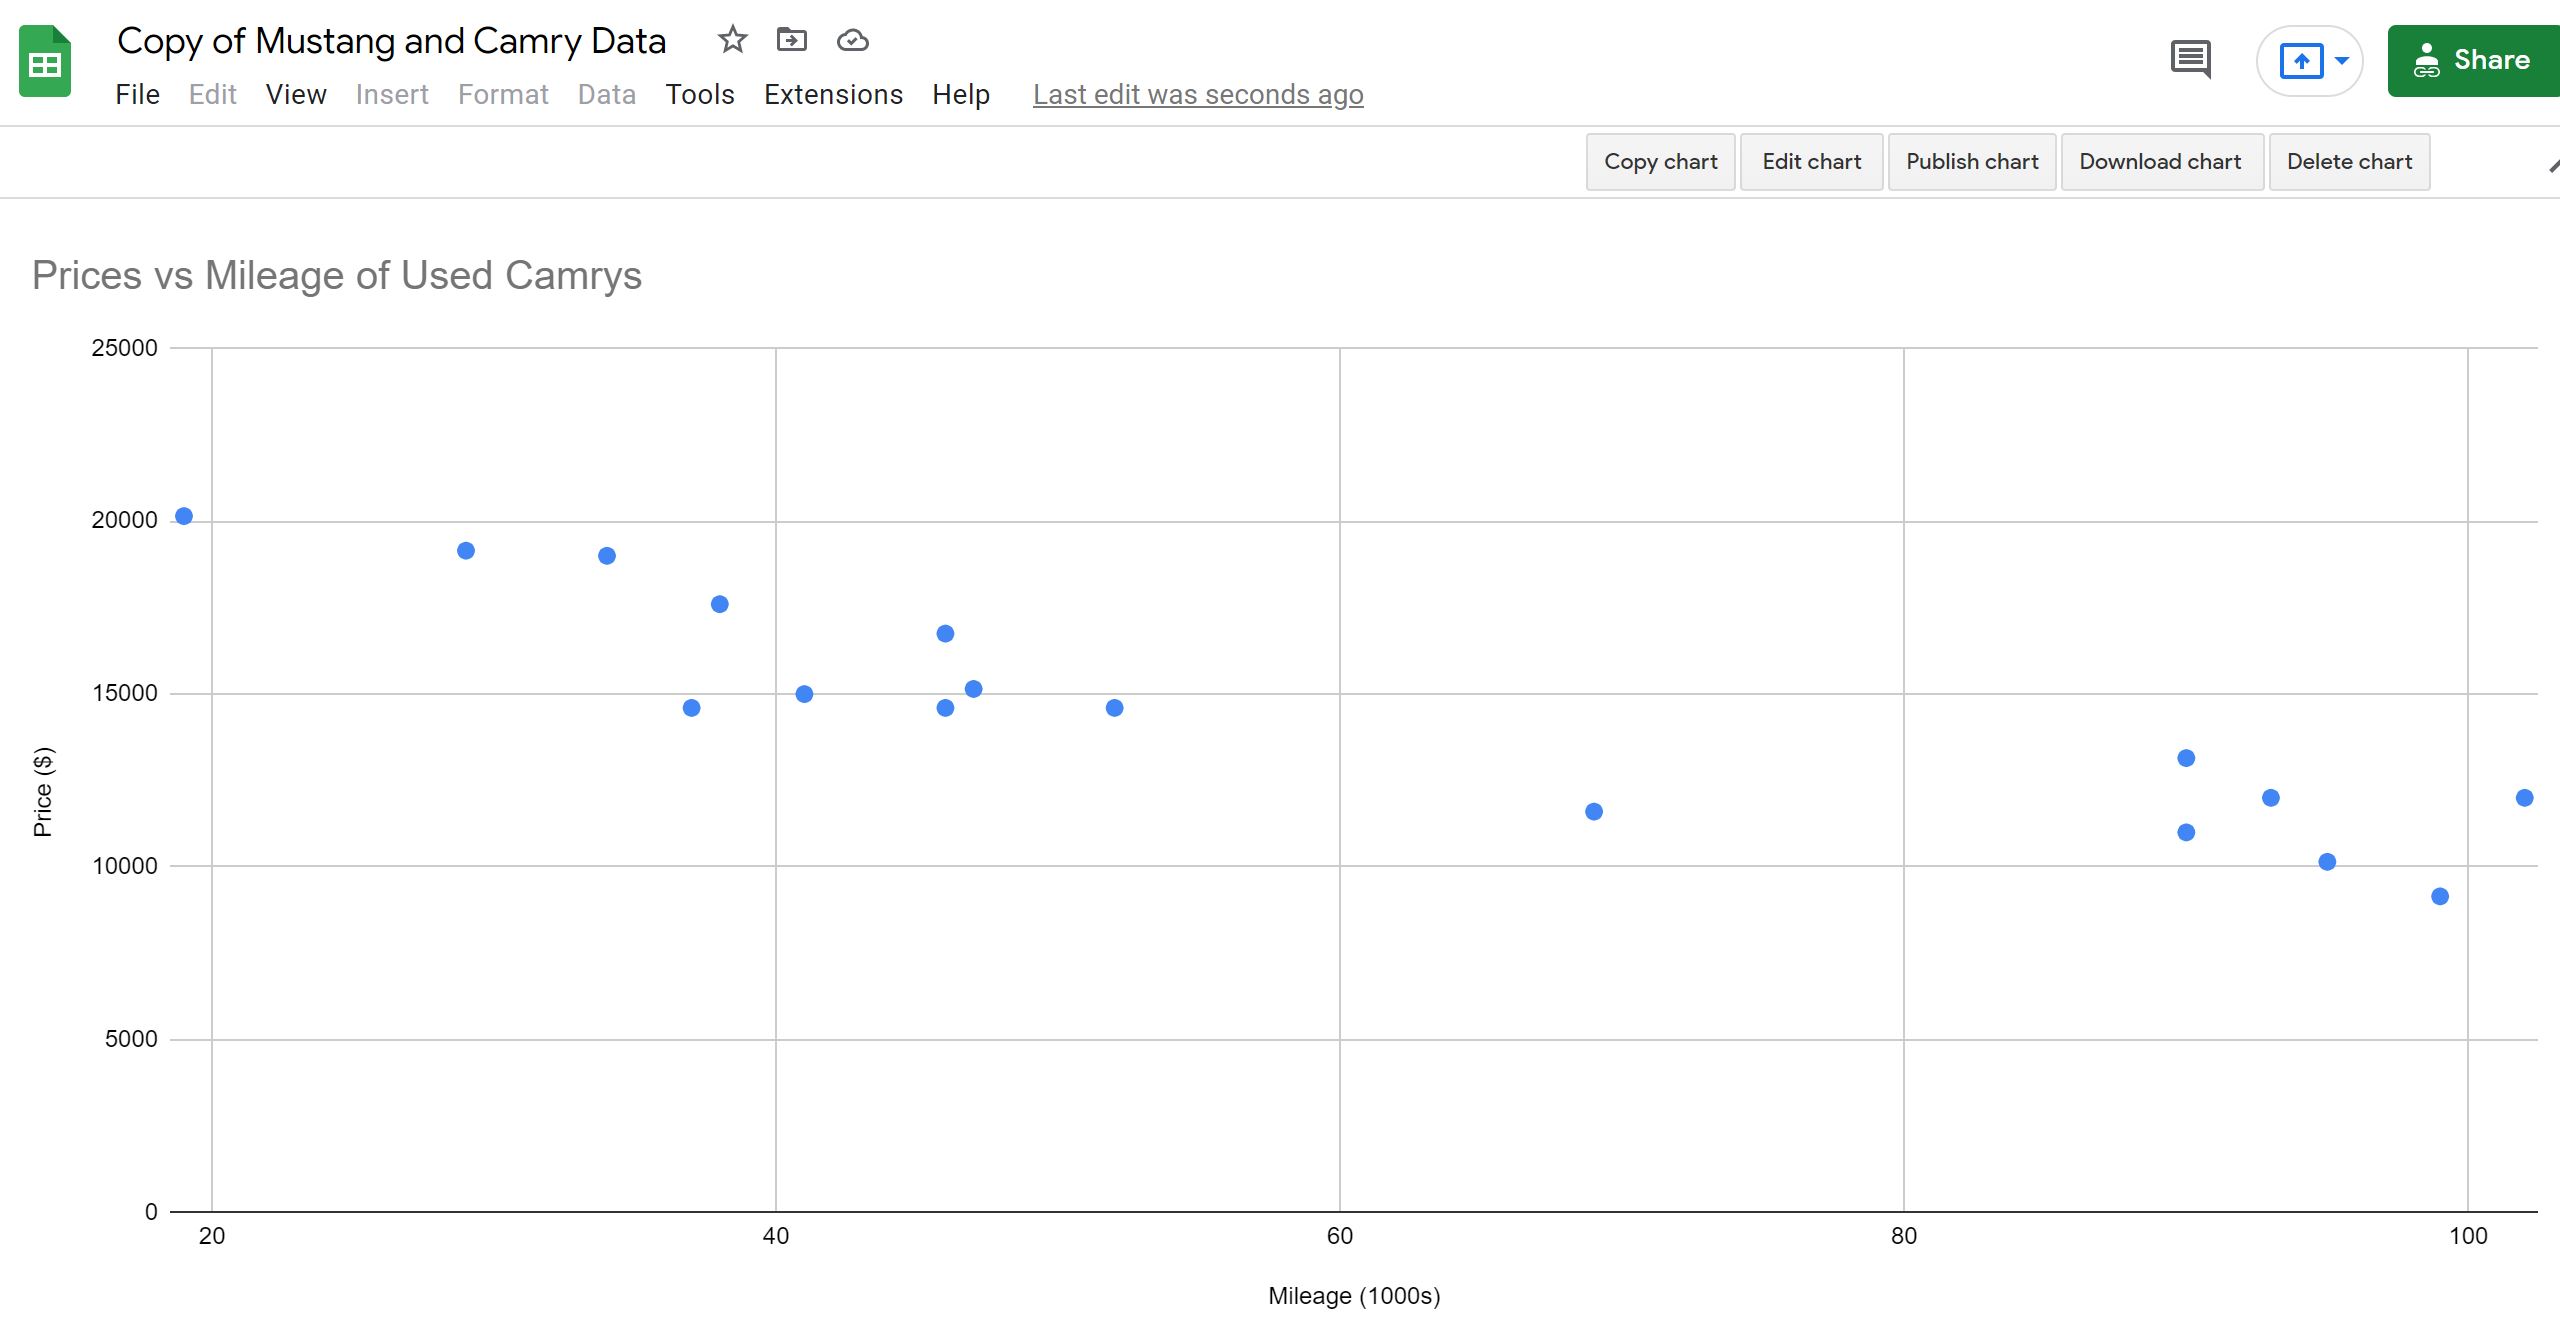
Introduction to Scatter Plots with Google Sheets
-
Unpacking Graphs Using a Rollercoaster

I introduce key characteristics with parabolas and use the analogy of a rollercoaster. Riding once (and never a again) the Superman rollercoaster at Six Flags New England got me thinking about this. At one point the roller coaster hits ground level (a zero) and then goes underground (negative y values). Handout Here is a handout…
-
Introduction to Key Characteristics of Graphs Using a Rollercoaster
I introduce key characteristics with parabolas and use the analogy of a rollercoaster. Riding once (and never a again) the Superman rollercoaster at Six Flags New England got me thinking about this. At one point the rollercaster hits ground level (a zero) and then goes underground (negative y values). Here is a handout I use…
-
Intro Linear & Proportional Relationship

This post provides a handout to introduce linear functions and proportional relationships. Multiple instructional strategies are implemented. There is context that draws upon prior knowledge, scaffolding, and visual representations. Graph and table representations of the functions are used as an entry point, without the use of equations. Overview There is a difference between proportional relationships…
-
Intro to Linear Functions and Proportionality Equations Using Context, Tables, and Graphs.