mustang
-
Intro to Reading Scatterplots – Used Mustangs

One step in reading and analyzing scatterplots is simply identifying what the dots on the graph represent. If students do not understand the dots (including the position) how can they analyze. An approach I have used is start by having students create their own scatterplot for mileage and price of used cars they shop for…
-
Reading Scatterplots with Ford Mustangs
One step in reading and analyzing scatterplots is simply identifying what the dots on the graph represent. Students who do not understand the meaning of the points, including the position, will struggle to interpret the graph. This post outlines a Jamboard activity to support interpretation of the points. Overview I present the scatterplot of used…
-
Intro to Systems of Equations: Camry vs Mustang Depreciation
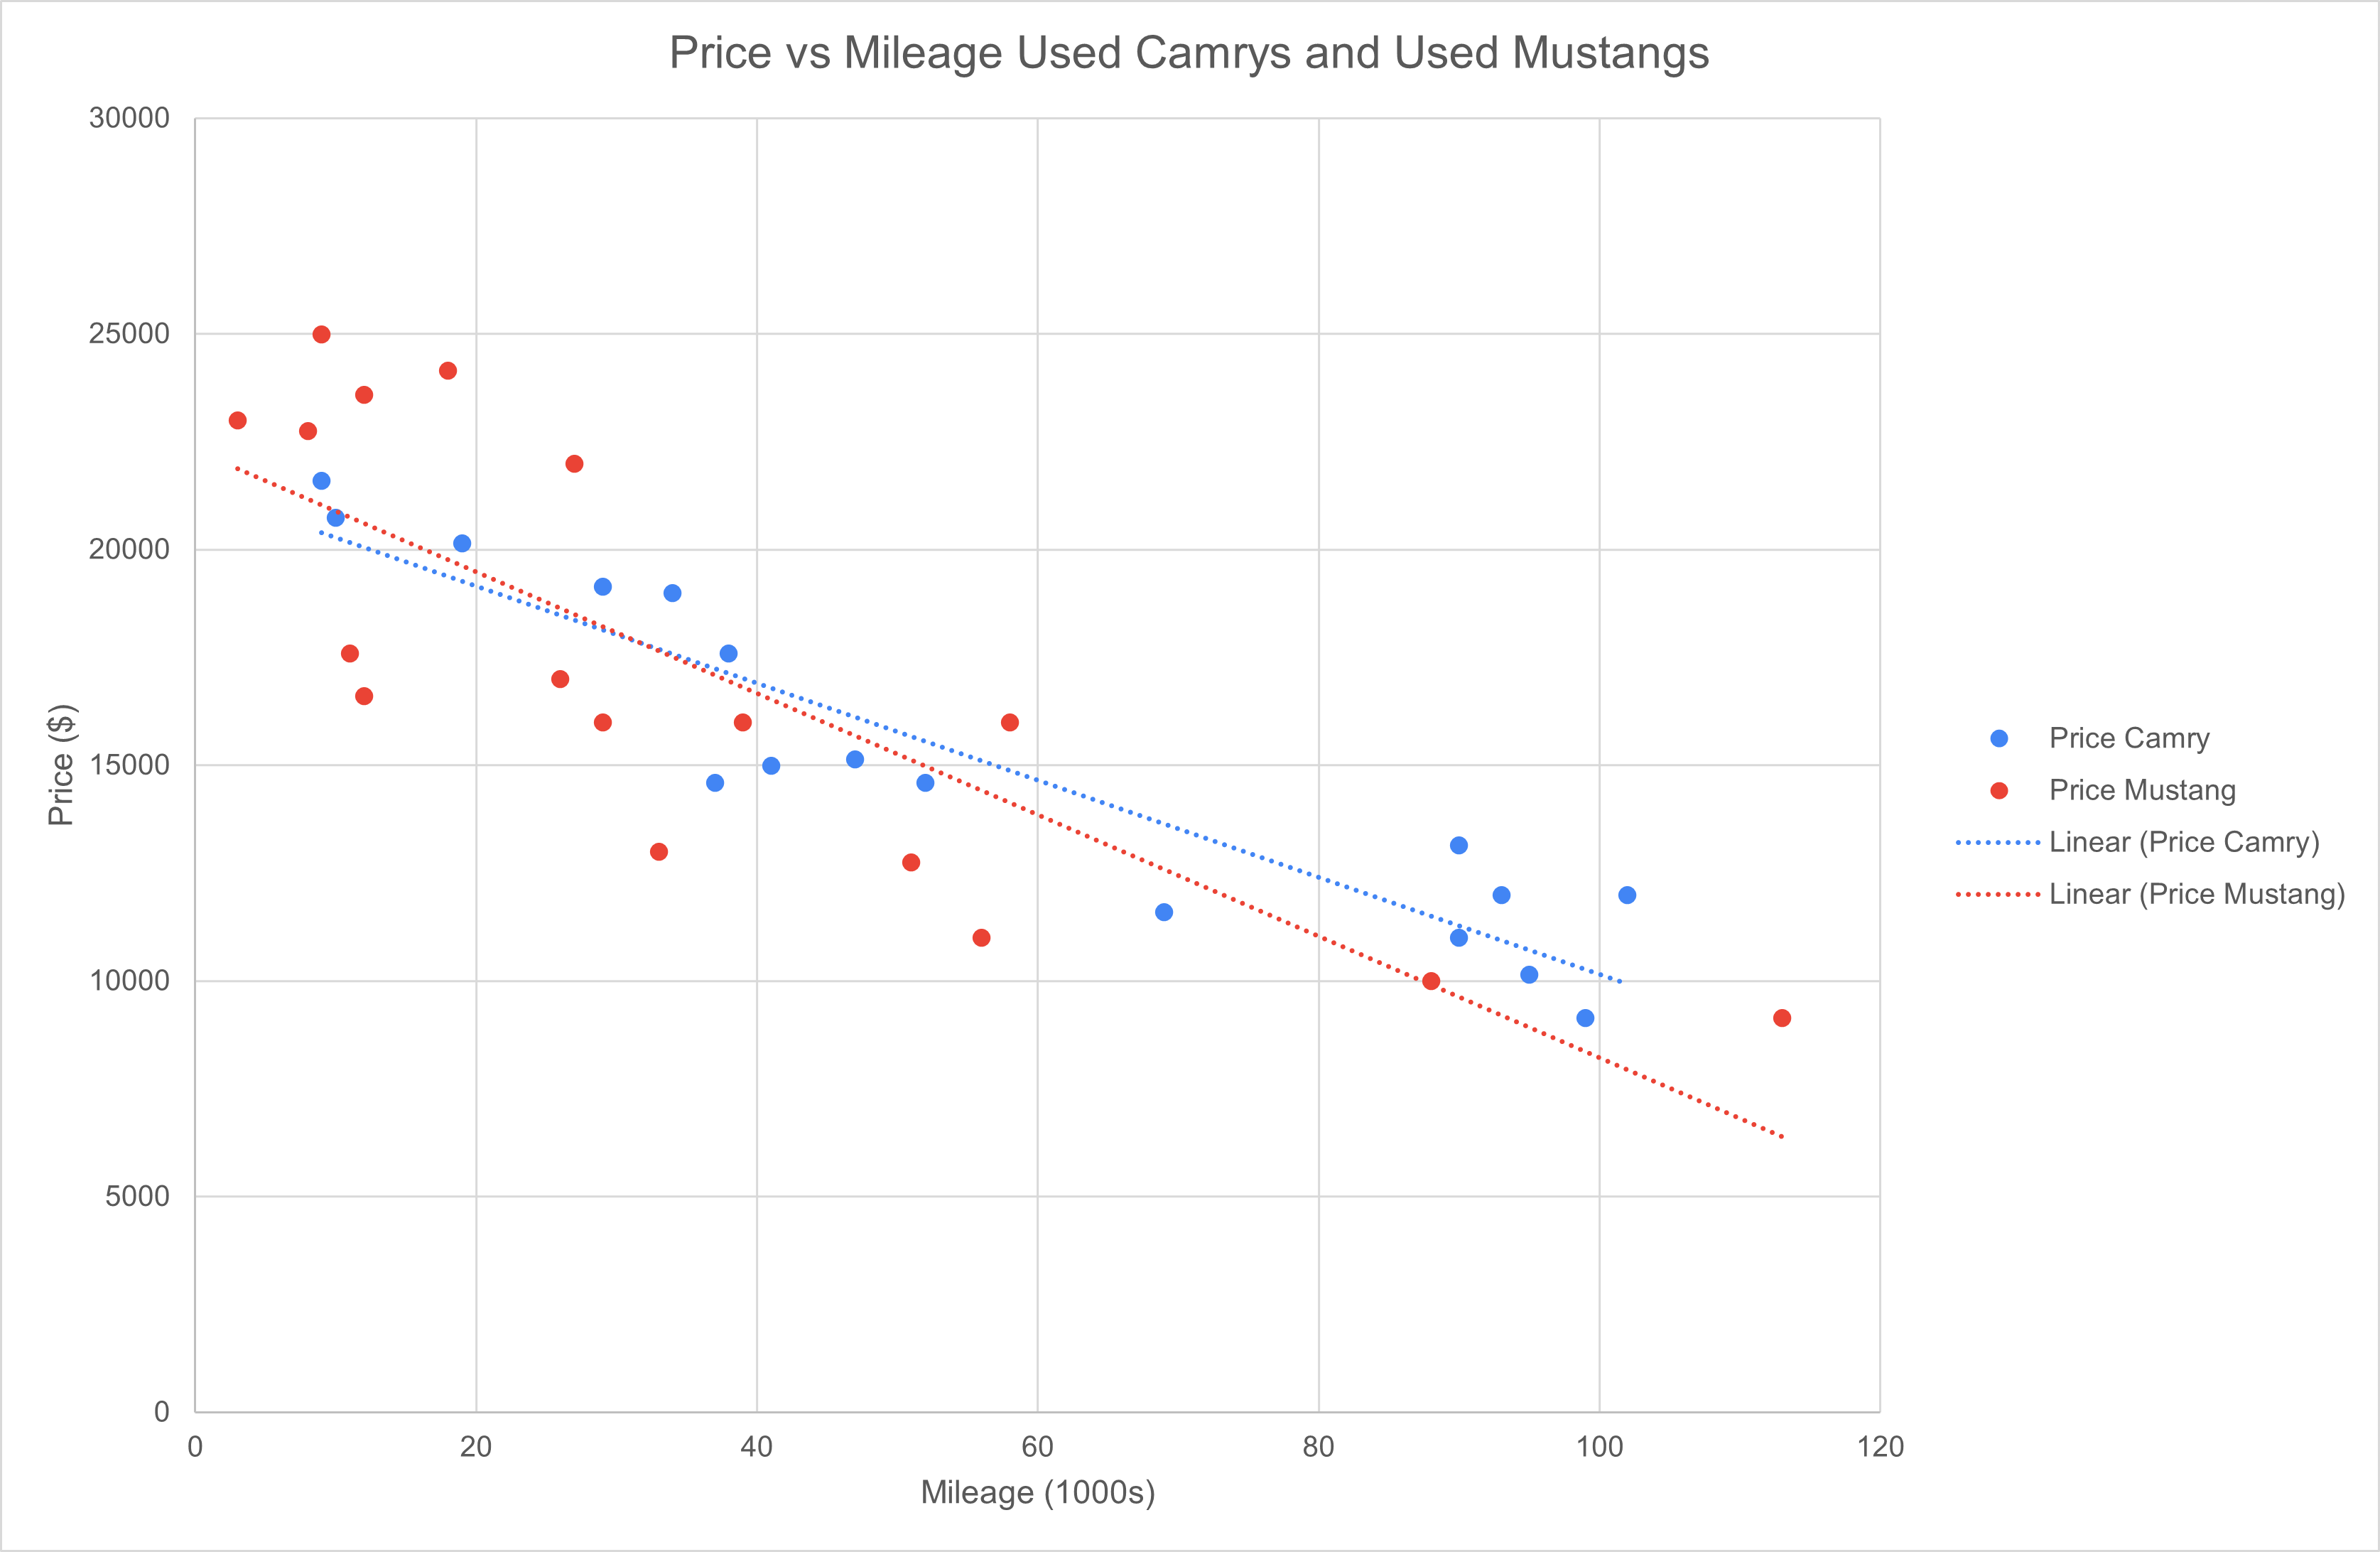
The scatterplot above is an approach I use to introduce systems of equations. Here is the process I use. (Note: I have found that students like math associated with buying a car – relevant, real life application for them.) In my class, students would have seen a scatterplot with mileage and price for a single…